Fig. 3.
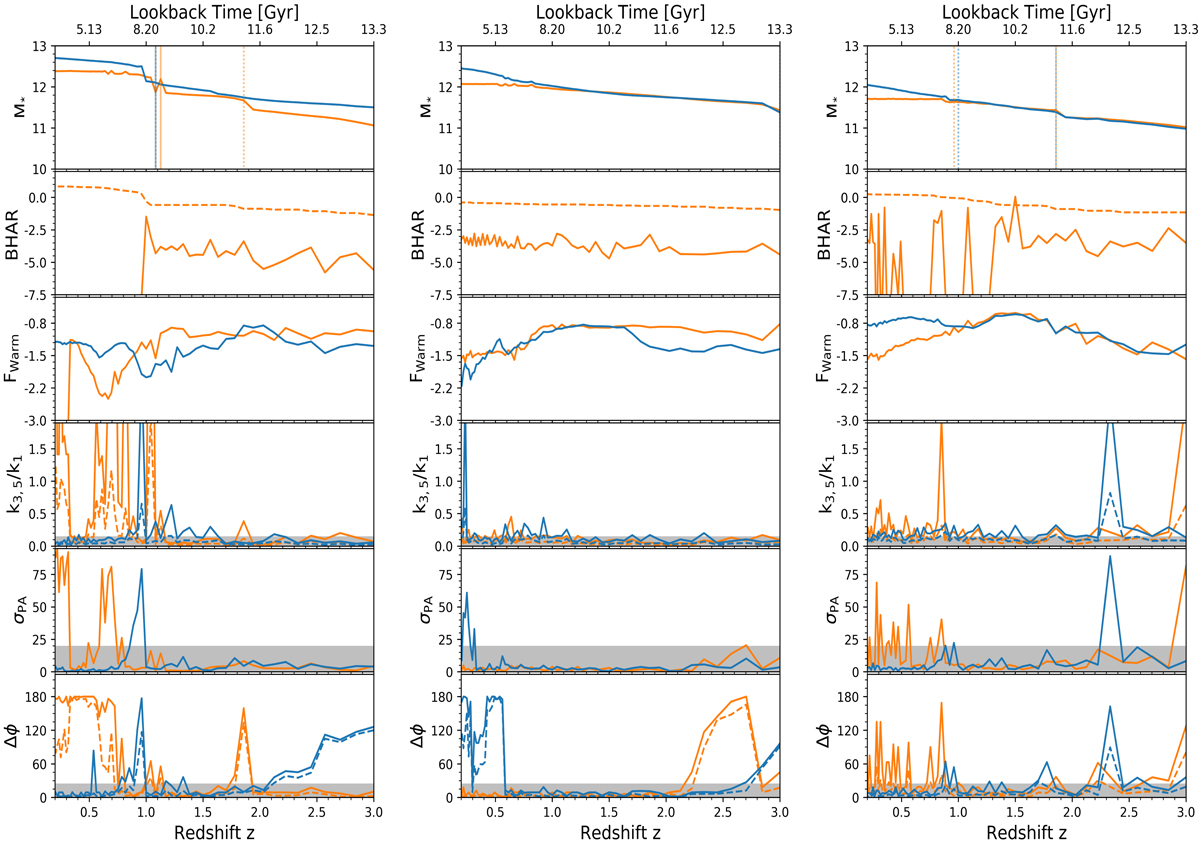
Cosmic evolution of the galaxy stellar mass within 1/10 of the virial radius, the BH accretion rate, the warm gas mass fractions, as well as the irregularity parameters k3, 5/k1, Δϕ, and σPA (panels from top to bottom) of our three example galaxies (0094: left column; 0215: middle column; 0290: right column) with (orange lines) and without (blue lines) AGN feedback from z = 3.0 to z = 0.2. In the panels showing the stellar mass histories (top row), solid lines indicate major mergers and dashed lines indicate minor mergers. The dashed lines in the panels in the second row represent the BH accretion rate at the Eddington limit. The gray areas in the panels showing the irregularity parameters (fourth to sixth rows) indicate the “regular” ranges (see Sect. 2.1), and the solid (dashed) lines illustrate the maximum (mean) values of each irregularity parameter within 1.5 re.
Current usage metrics show cumulative count of Article Views (full-text article views including HTML views, PDF and ePub downloads, according to the available data) and Abstracts Views on Vision4Press platform.
Data correspond to usage on the plateform after 2015. The current usage metrics is available 48-96 hours after online publication and is updated daily on week days.
Initial download of the metrics may take a while.