Fig. A.3.
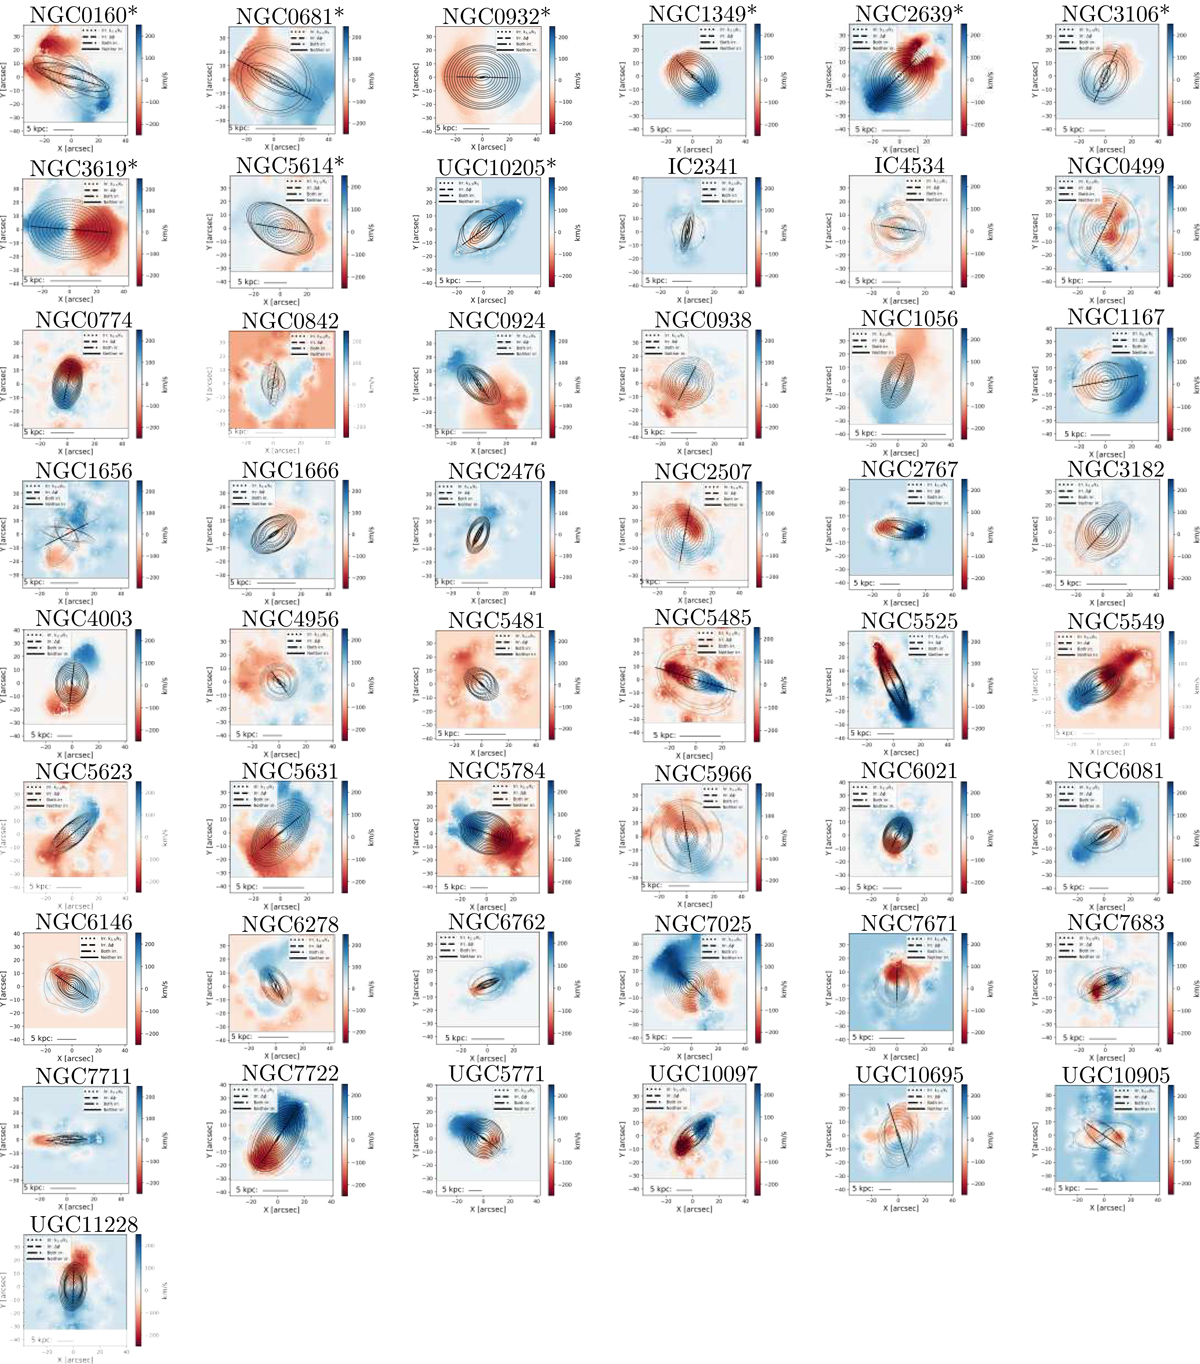
Velocity maps of the warm gas in the 49 galaxies in our observed data sample. Asterisks by galaxy names denote those currently affected by AGN activity, as determined by the WHAN analysis. Only those data points contained in the “masks” (see main text) are plotted. The star in each map marks the brightest continuum pixel, which was used as the center of the map for kinematic fitting. The line extending across the maps is oriented at the median position angle of the best-fitting ellipses within 1.5 re. The solid portion of the line has the length of the galaxy’s effective radius from the center along the major axis, while the dotted portion represents the remaining fit portion up to 1.5 re. The plotted ellipses are the best-fitting ellipses at every radius; the ellipses’ flattenings and position angles were allowed to vary between radii. The standard deviation of these ellipses’ position angles is σPA, and the position angles were compared with those of the stellar velocity to compute Δϕ. We note that k3, 5/k1 was calculated based on a different set of ellipses at the same radii with fixed position angles (all oriented along the solid line) and flattenings (the median flattening of the first set of ellipses). The linestyles of the ellipses correspond to the values of the irregularity parameters as follows: a solid line means that both k3, 5/k1 and Δϕ are within the regular ranges, a dotted line means that k3, 5/k1 is irregular, a dashed line means that Δϕ is irregular, and a dashed-dotted line means that both are irregular.
Current usage metrics show cumulative count of Article Views (full-text article views including HTML views, PDF and ePub downloads, according to the available data) and Abstracts Views on Vision4Press platform.
Data correspond to usage on the plateform after 2015. The current usage metrics is available 48-96 hours after online publication and is updated daily on week days.
Initial download of the metrics may take a while.