Fig. 1.
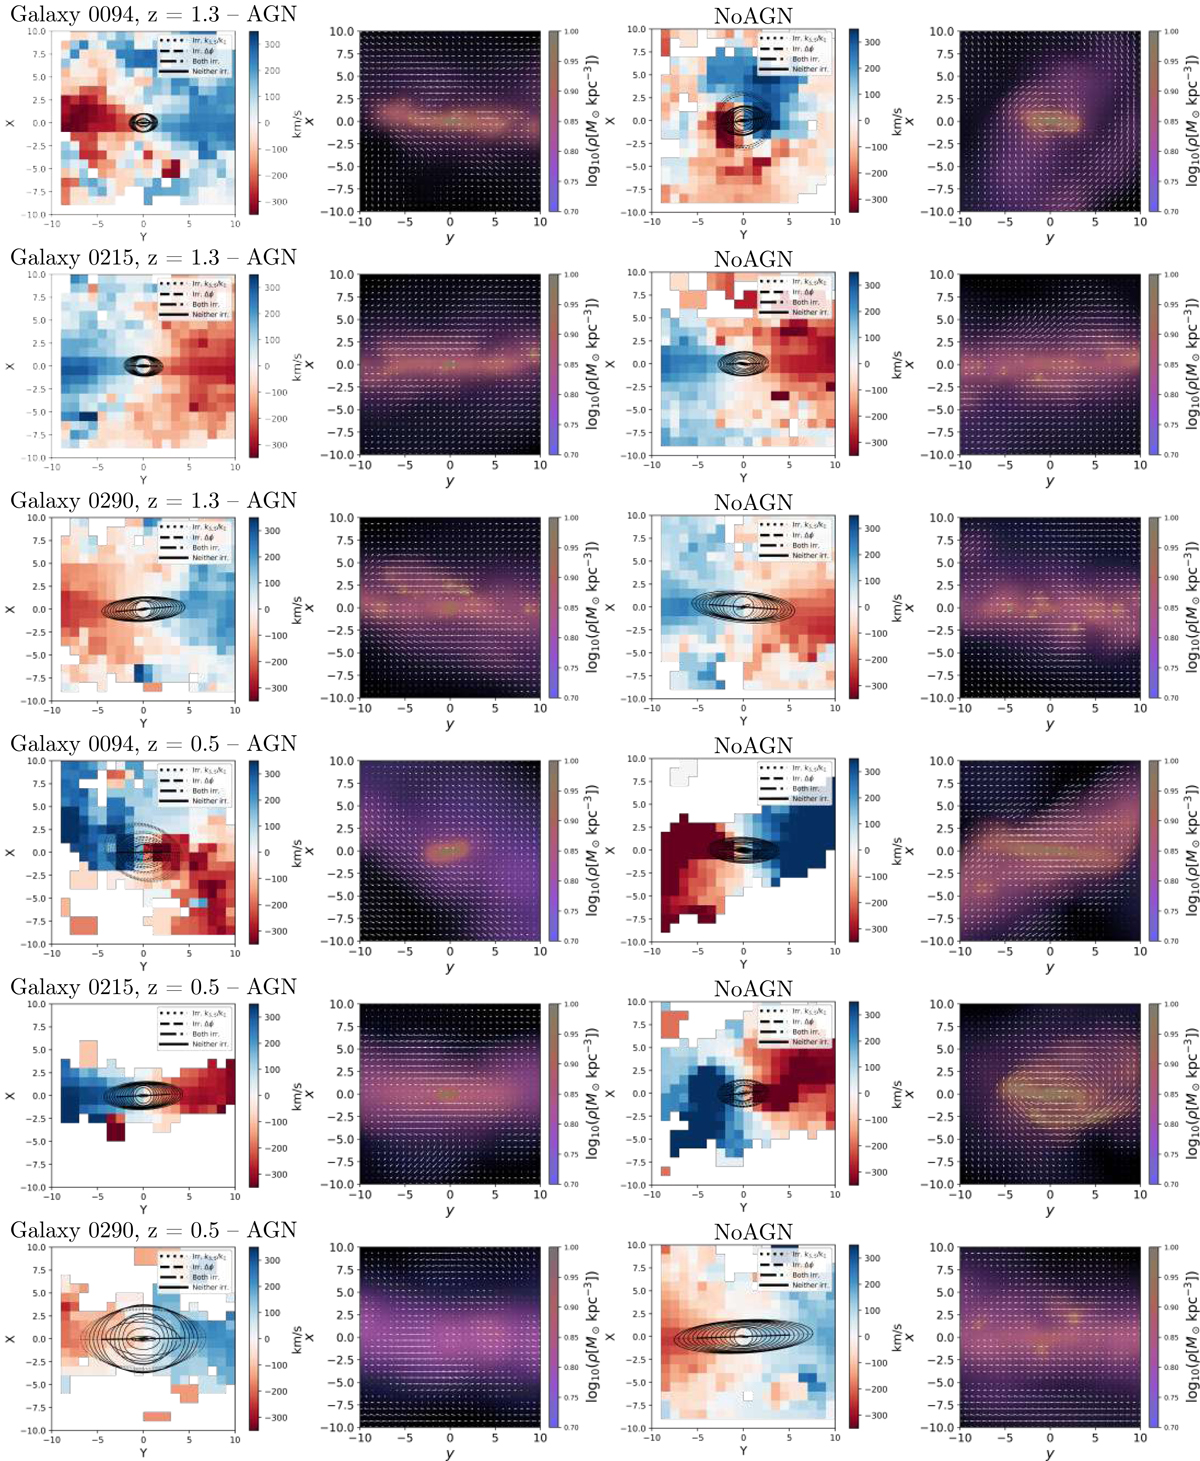
Velocity and density maps (with velocities overplotted as white arrows) of the warm gas content of the galaxies 0094 (first and fourth row), 0215 (second and fifth row), and 0290 (third and sixth row), at z = 1.3 (top three rows) and at z = 0.5 (bottom three rows), simulated with (first and second columns) and without AGN feedback (third and fourth columns). The line across the velocity maps is oriented at the median position angle of the best-fitting ellipses within 1.5 re, the extent of the solid line illustrates the galaxy’s effective radius. The plotted ellipses are the best-fitting ellipses at every radius with flattenings and position angles as free parameters at each radius. Following the definitions of regularity and irregularity of Kutdemir et al. (2008, 2010), regular ranges of k3, 5/k1 and Δϕ are illustrated by solid lines of the ellipses; the irregular k3, 5/k1 range is illustrated by dotted lines, irregular Δϕ by dashed lines, and irregular values of both k3, 5/k1 and Δϕ by dashed-dotted lines.
Current usage metrics show cumulative count of Article Views (full-text article views including HTML views, PDF and ePub downloads, according to the available data) and Abstracts Views on Vision4Press platform.
Data correspond to usage on the plateform after 2015. The current usage metrics is available 48-96 hours after online publication and is updated daily on week days.
Initial download of the metrics may take a while.