Fig. 7.
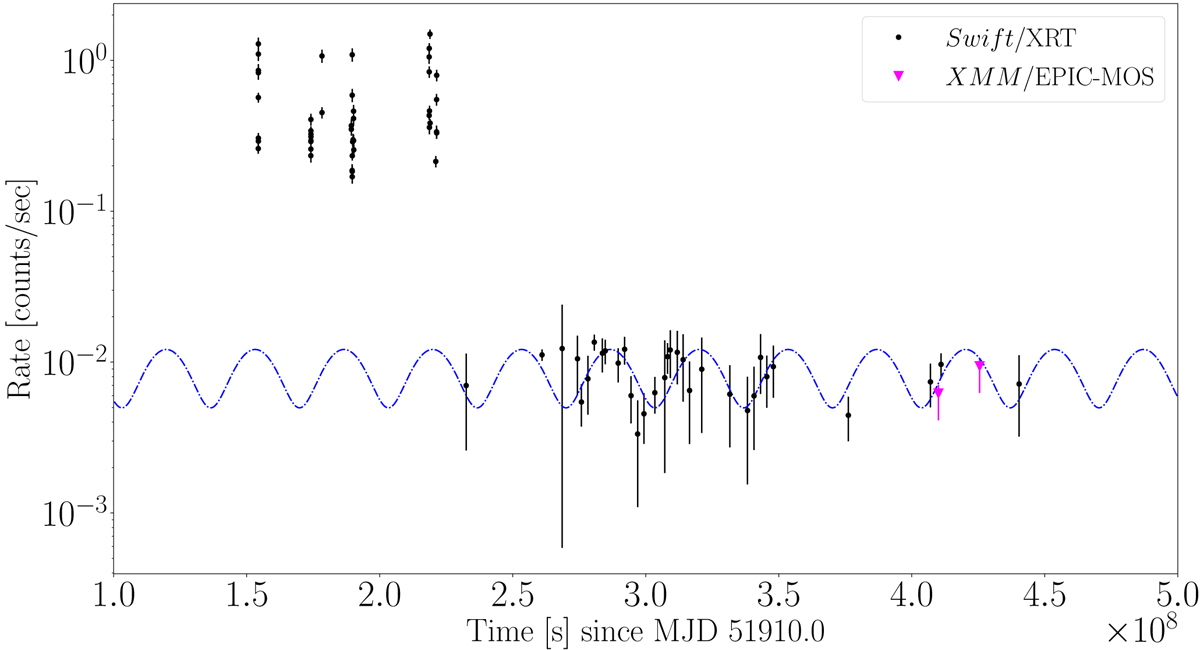
Swift/XRT count rate light curve of J12270. The two XMM-Newton observations were plotted with magenta triangles. These data were extrapolated to XRT counts through spectral modelling, including the uncertainty in the XMM-Newton flux. The overall X-ray light curve shows J12270 bright in the X-ray band at early times, and then a turn off to quiescence. During quiescence, a clear variability is apparent in the light curve.
Current usage metrics show cumulative count of Article Views (full-text article views including HTML views, PDF and ePub downloads, according to the available data) and Abstracts Views on Vision4Press platform.
Data correspond to usage on the plateform after 2015. The current usage metrics is available 48-96 hours after online publication and is updated daily on week days.
Initial download of the metrics may take a while.