Fig. 1.
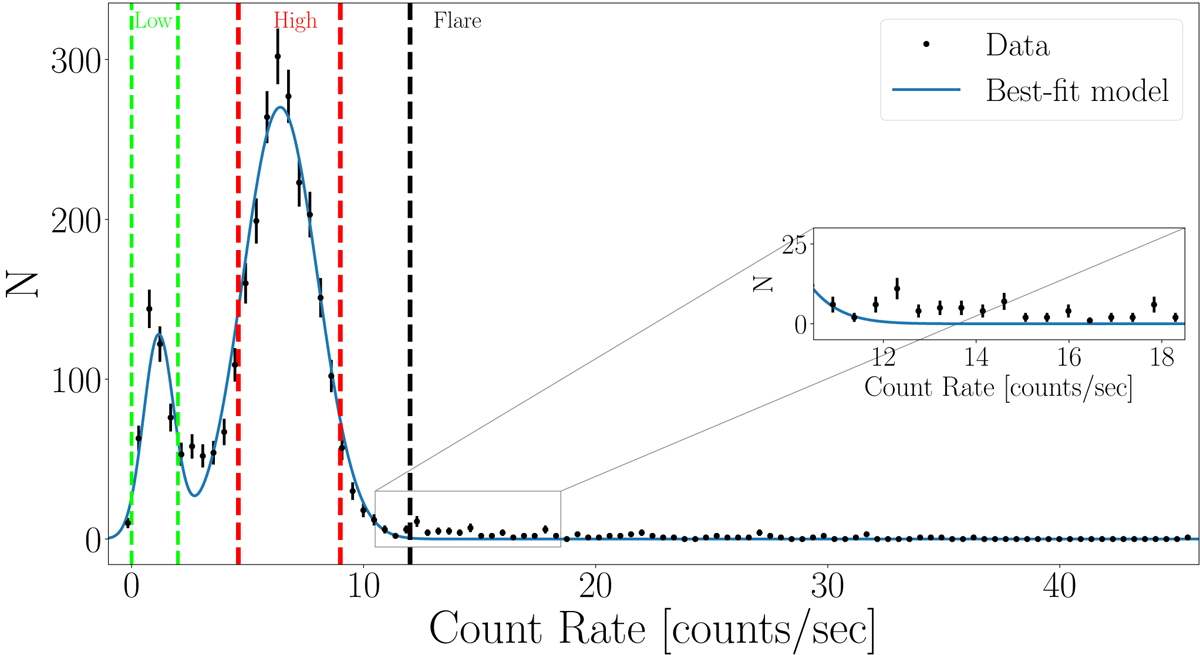
Distribution of the background-subtracted J12270 count rate obtained from 20 s binned lightcurves from the 2009 January and 2011 January XMM-Newton EPIC data. We define the region between 0 cts s−1 and 2 cts s−1 as the low-soft mode, while the region between 4.6 cts s−1 and 9 cts s−1 is the high mode. Higher than 12 count s−1 we define flare mode. In the zoomed plot we can see that the double Gaussian fit does not interpolate data during the flares.
Current usage metrics show cumulative count of Article Views (full-text article views including HTML views, PDF and ePub downloads, according to the available data) and Abstracts Views on Vision4Press platform.
Data correspond to usage on the plateform after 2015. The current usage metrics is available 48-96 hours after online publication and is updated daily on week days.
Initial download of the metrics may take a while.