Fig. 9
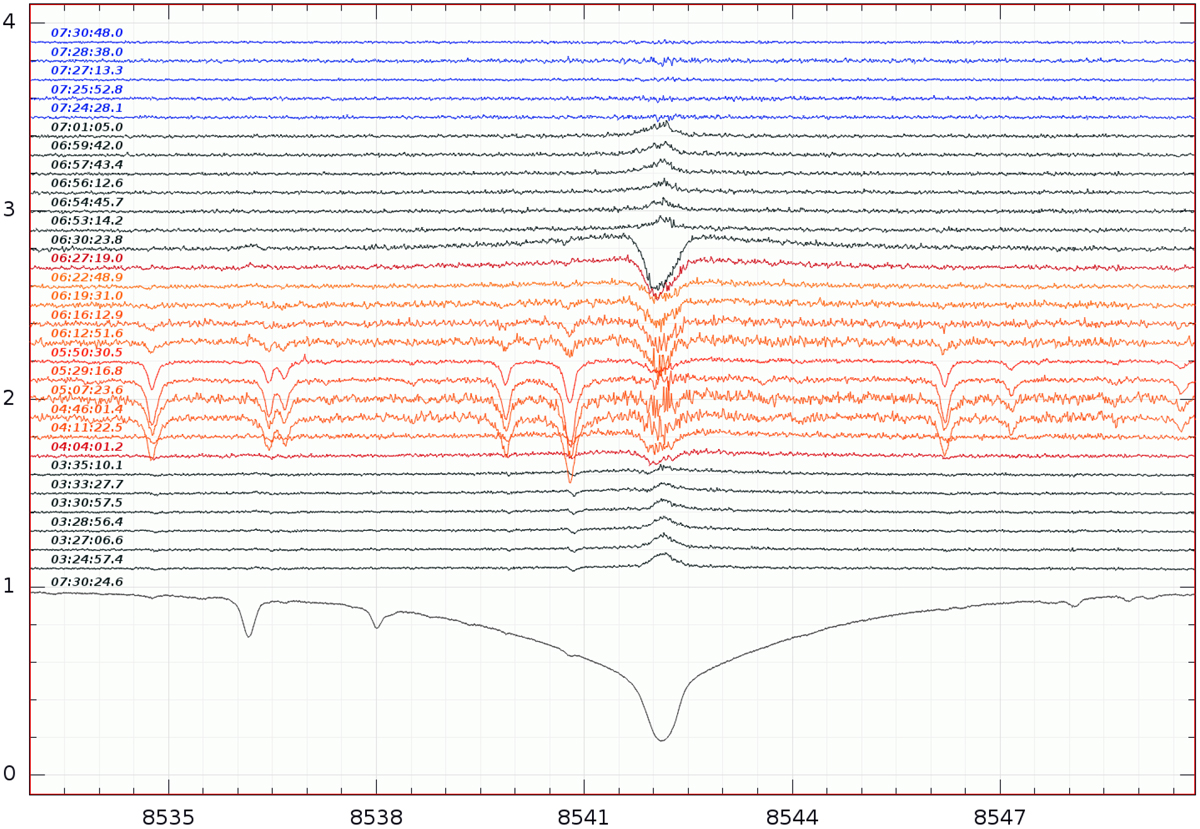
Ratio spectra during eclipse with respect to out-of-eclipse for the Ca II IRT λ8542-Å line. The bottom spectrum is the average out-of-eclipse spectrum from around UT 7:30 used for the ratio. All three calcium IRT lines show excess absorption in the line core during eclipse. The excess absorption appears during the deepest penumbral phase at ingress at around UT 3:35 and disappears at around UT 6:50 shortly after the deepest penumbral phase at egress. It appeared twice as strong at egress than at ingress. This is likely only because the comparable egress phase was not covered with CD VI. The red-colored spectra in the figure indicate the umbral phases, theblack colored the penumbral, and the blue colored the out-of-eclipse phases (top five spectra). The x-axis is wavelength in Ångstroem. We also note that time increases from bottom to top but is not equidistant.
Current usage metrics show cumulative count of Article Views (full-text article views including HTML views, PDF and ePub downloads, according to the available data) and Abstracts Views on Vision4Press platform.
Data correspond to usage on the plateform after 2015. The current usage metrics is available 48-96 hours after online publication and is updated daily on week days.
Initial download of the metrics may take a while.