Fig. 8
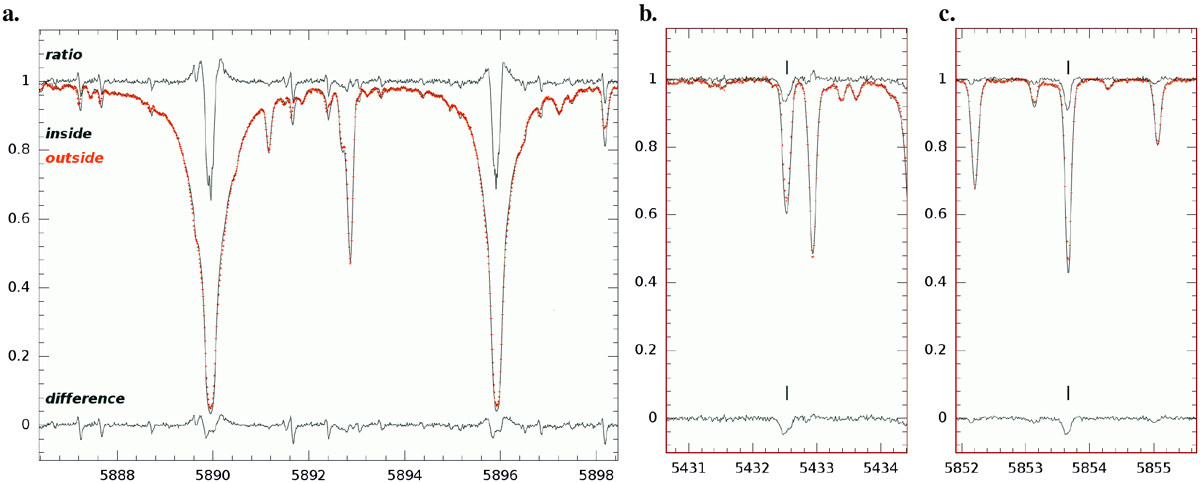
Comparison of difference and ratio spectra at deep penumbral phase during ingress. (a) the Na I D lines at 5890 Å and 5896 Å, (b) the Mn I line at 5432.5 Å (with a close Fe I line at 5433 Å that does not show excess absorption) and, (c), the Ba II line at 5853.7 Å. The two middle spectra in each panel are the observed spectrum outside eclipse (red pluses) and the Ring-corrected spectrum inside eclipse (black line). The spectrum at unit intensity is the ratio, and the spectrum at zero intensity the difference, always with respect to the observed lunar spectrum outside eclipse. All eclipse spectra are from UT 3:50 during ingress. The x-axes are wavelength in Ångstroem.
Current usage metrics show cumulative count of Article Views (full-text article views including HTML views, PDF and ePub downloads, according to the available data) and Abstracts Views on Vision4Press platform.
Data correspond to usage on the plateform after 2015. The current usage metrics is available 48-96 hours after online publication and is updated daily on week days.
Initial download of the metrics may take a while.