Fig. 6
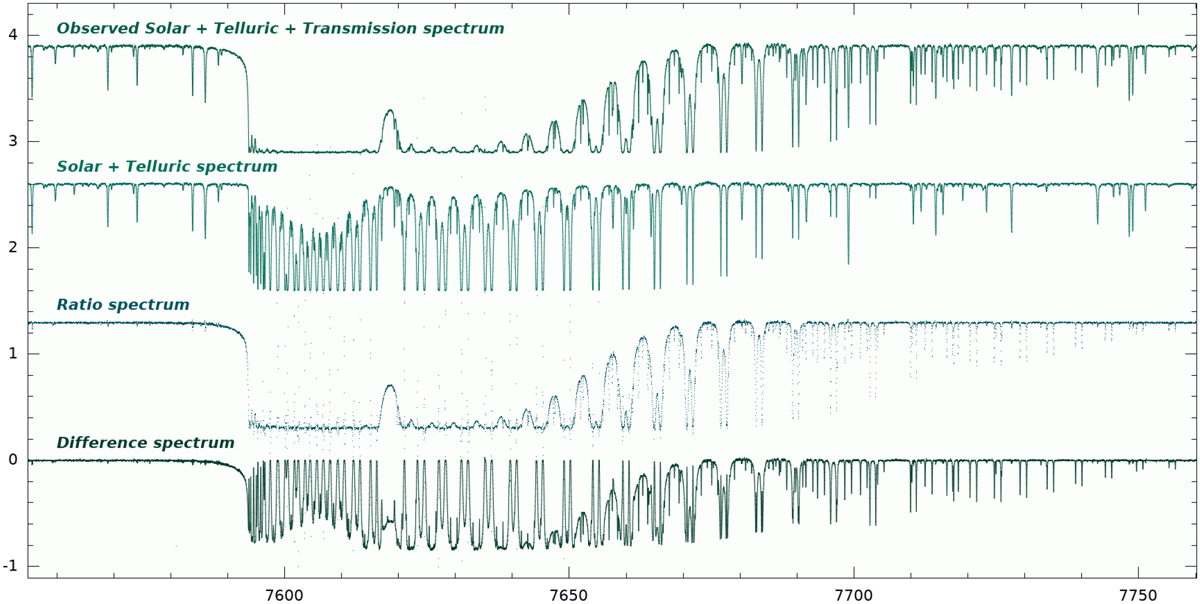
Comparison of the spectrum components in the O2 A-band. The top spectrum is the observed spectrum during umbral eclipse with all components in it. The next lower spectrum is the solar plus the telluric component obtained from a smoothing-spline fit to all spectra versus air mass and time. The two bottom spectra are the ratio and the difference of above, respectively, and reveal the Earth’s transmission spectrum. A vertical offset of 1.3 is applied for better visibility. Wavelengths are in Ångstroem. We note that the ratio spectrum is plotted with dots in order not to overemphasize the many divisions by nearly zero.
Current usage metrics show cumulative count of Article Views (full-text article views including HTML views, PDF and ePub downloads, according to the available data) and Abstracts Views on Vision4Press platform.
Data correspond to usage on the plateform after 2015. The current usage metrics is available 48-96 hours after online publication and is updated daily on week days.
Initial download of the metrics may take a while.