Fig. 4
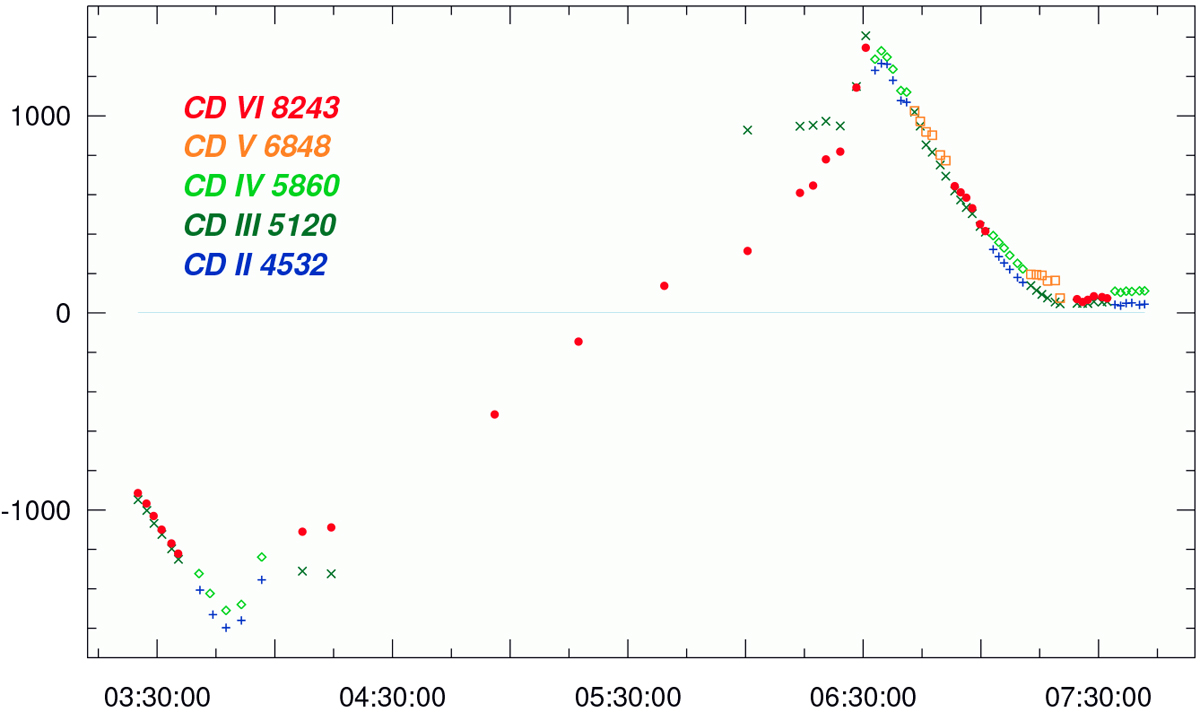
Heliocentric radial velocities in m s−1 from the lunar Tycho region. The dots are our relative velocities from solar absorption lines with respect to the IAG FTS solar atlas (Reiners et al. 2016). The colors denote the wavelengths at which the velocities were measured and are identified in the insert (CD is the cross disperser and its respective central wavelengthin Å; symbols are dots = CD VI, squares = CD V, diamonds = CD IV, crosses = CD III, pluses = CD II). The observed velocities trace the Rossiter-McLaughlin effect from Earth transiting in front of the Sun as seen from Tycho on the Moon.
Current usage metrics show cumulative count of Article Views (full-text article views including HTML views, PDF and ePub downloads, according to the available data) and Abstracts Views on Vision4Press platform.
Data correspond to usage on the plateform after 2015. The current usage metrics is available 48-96 hours after online publication and is updated daily on week days.
Initial download of the metrics may take a while.