Fig. 2
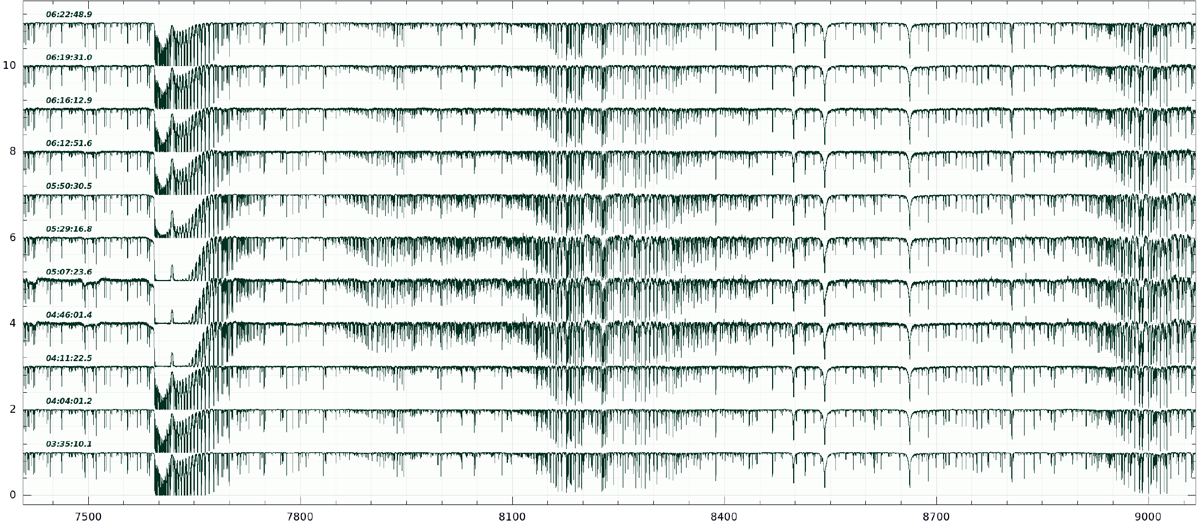
Time series of Stokes-I spectra around umbral eclipse. Wavelengths are given in Ångstroem, individual spectra are offset by 1.0in intensity for better viewing. Shown is the entire wavelength range of CD VI. Notice the deepening of the O2 A-band absorption at 7600 Å during umbral eclipse between UT 4:46 and 5:50. Its absorption became so dominant that no light at these wavelengths was left except a residual emission feature at 7618 Å. Increased absorption line strengths of other molecular bands are also seen, most notably for the H2 O bands between 7850–8450 Å.
Current usage metrics show cumulative count of Article Views (full-text article views including HTML views, PDF and ePub downloads, according to the available data) and Abstracts Views on Vision4Press platform.
Data correspond to usage on the plateform after 2015. The current usage metrics is available 48-96 hours after online publication and is updated daily on week days.
Initial download of the metrics may take a while.