Fig. A.3
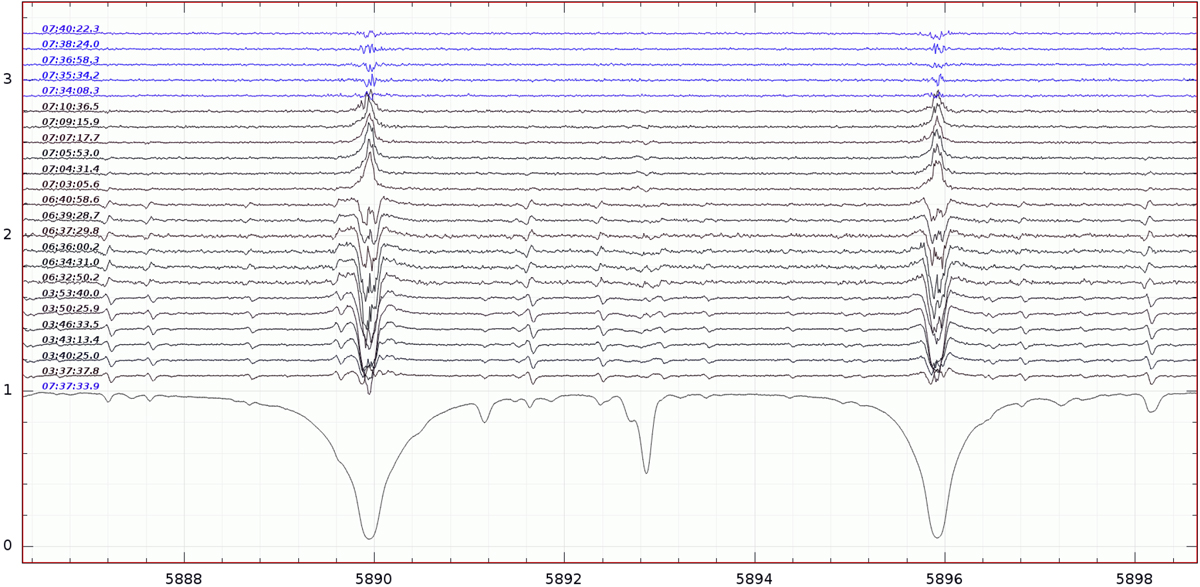
Na D ratio spectra during penumbral eclipse (black) compared to out-of-eclipse (blue; top five spectra). Each spectrum is labeled with its UT at start of exposure. Bottom spectrum: single out-of-eclipse spectrum. The deeper penumbral phases are reconstructed with excess Na D absorption while the shallow penumbral phases (UT 7:03–7:10) are not. We also note that the strong excess absorption during the deep penumbral ingress at UT 3:50 could not have been seen with CD VI (which includes the O2 A-band, the neutral K line, and the Ca IRT) because CD IV was used instead. The residual excess emissions during shallow penumbral eclipse are due to the improper Ring corrections for these phases (see text). Wavelengths are in Ångstroem and a vertical offset of 0.1 is applied.
Current usage metrics show cumulative count of Article Views (full-text article views including HTML views, PDF and ePub downloads, according to the available data) and Abstracts Views on Vision4Press platform.
Data correspond to usage on the plateform after 2015. The current usage metrics is available 48-96 hours after online publication and is updated daily on week days.
Initial download of the metrics may take a while.