Fig. A.1
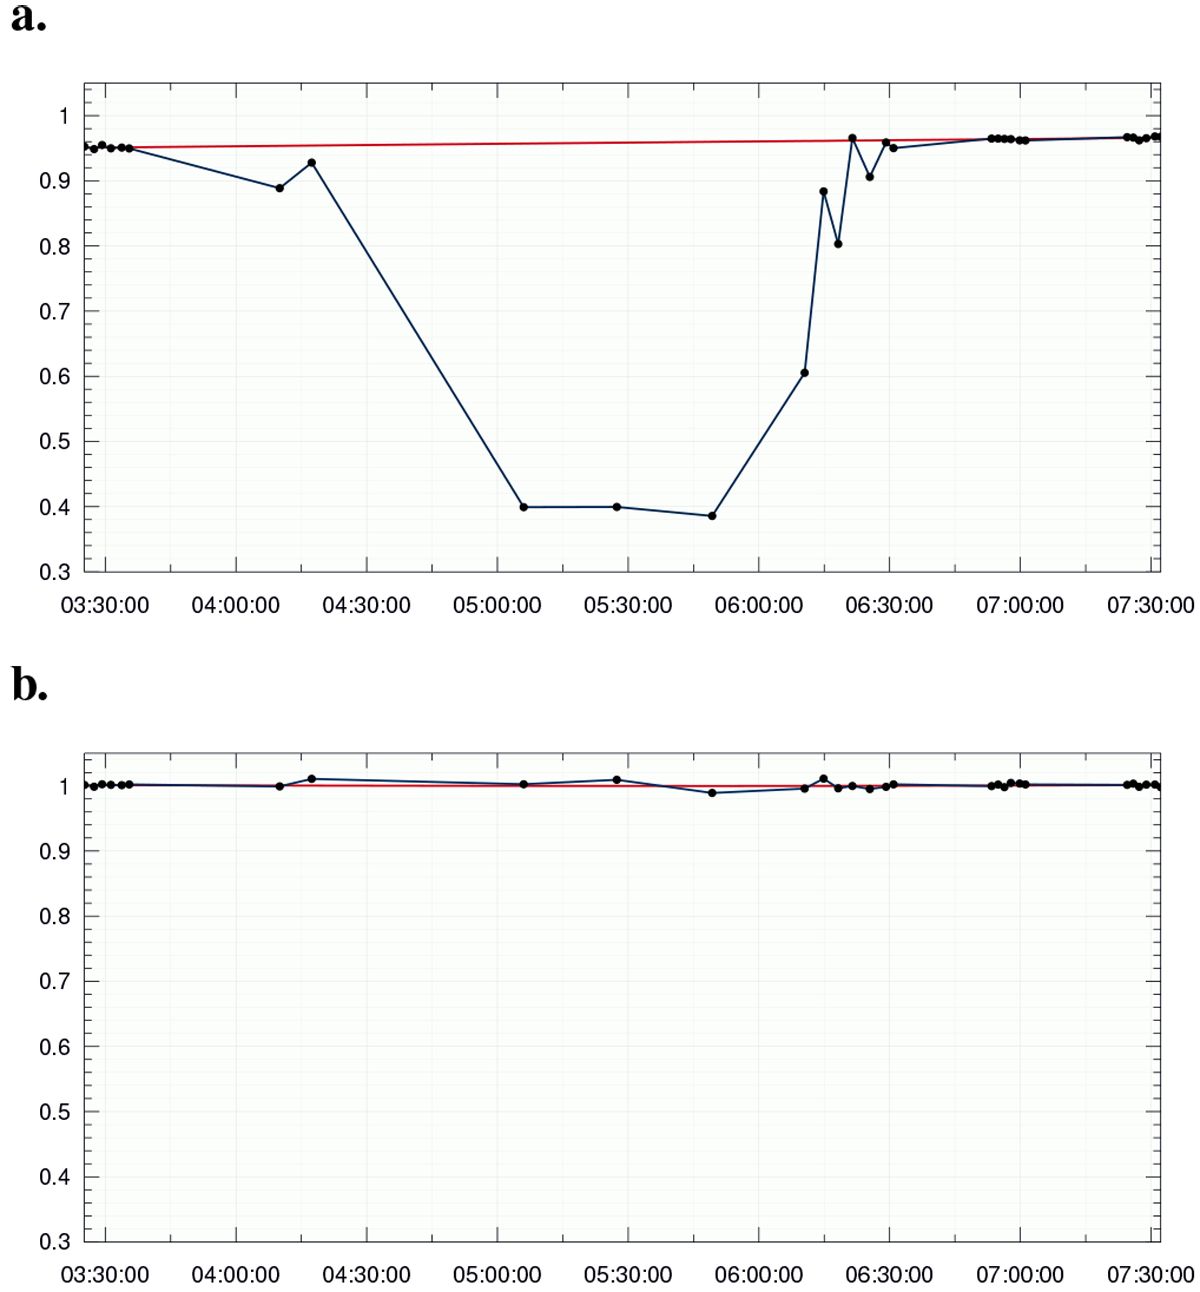
Relative intensity of the telluric contribution to the CD-VI spectra at two wavelengths. Panel a: at 7618 Å with a strong telluric line, (b) at 7585 Å without significant telluric contamination. The dots were derived from a spline fit to every pixel versus time. The top smooth line is the low-order spline fit that represents the air mass changes during our observations. X-axis is time in UT.
Current usage metrics show cumulative count of Article Views (full-text article views including HTML views, PDF and ePub downloads, according to the available data) and Abstracts Views on Vision4Press platform.
Data correspond to usage on the plateform after 2015. The current usage metrics is available 48-96 hours after online publication and is updated daily on week days.
Initial download of the metrics may take a while.