Fig. 11
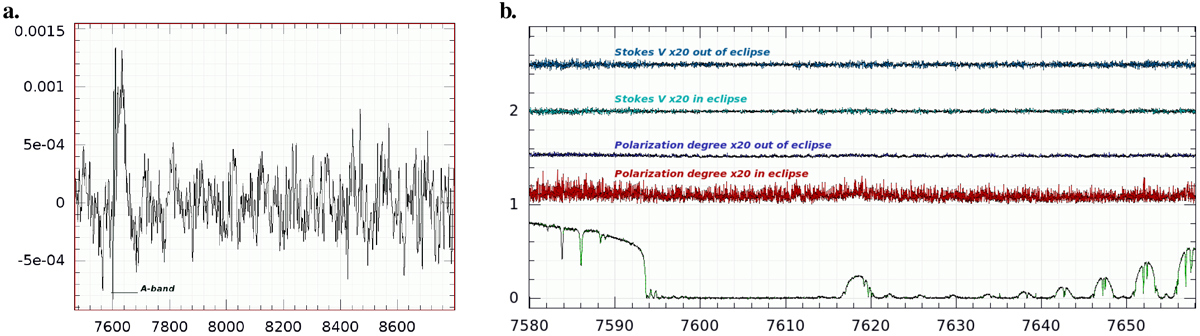
Panel a: degree of continuum polarization of the O2 A-band during umbral eclipse. The x-axis is wavelength in Ångstroem. Shown is Q∕I from a convolution of the spectra with a Gaussian of 300 km s−1 to prevent divisions by zero. The horizontal bar indicates the wavelength span of the major A-band lines. Panel b: degree of line polarization around the pseudo emission line at 7618 Å outside and inside eclipse. The two top spectra are Stokes-V, the two middle spectra are the degree of polarization built from Q and U, the bottom spectrum is Stokes-I for comparison and shows the residual O2 pseudo emission at 7618 Å. All polarized spectra are arbitrarily offset and enlarged by a factor of 20 compared to Stokes-I.
Current usage metrics show cumulative count of Article Views (full-text article views including HTML views, PDF and ePub downloads, according to the available data) and Abstracts Views on Vision4Press platform.
Data correspond to usage on the plateform after 2015. The current usage metrics is available 48-96 hours after online publication and is updated daily on week days.
Initial download of the metrics may take a while.