Fig. 10
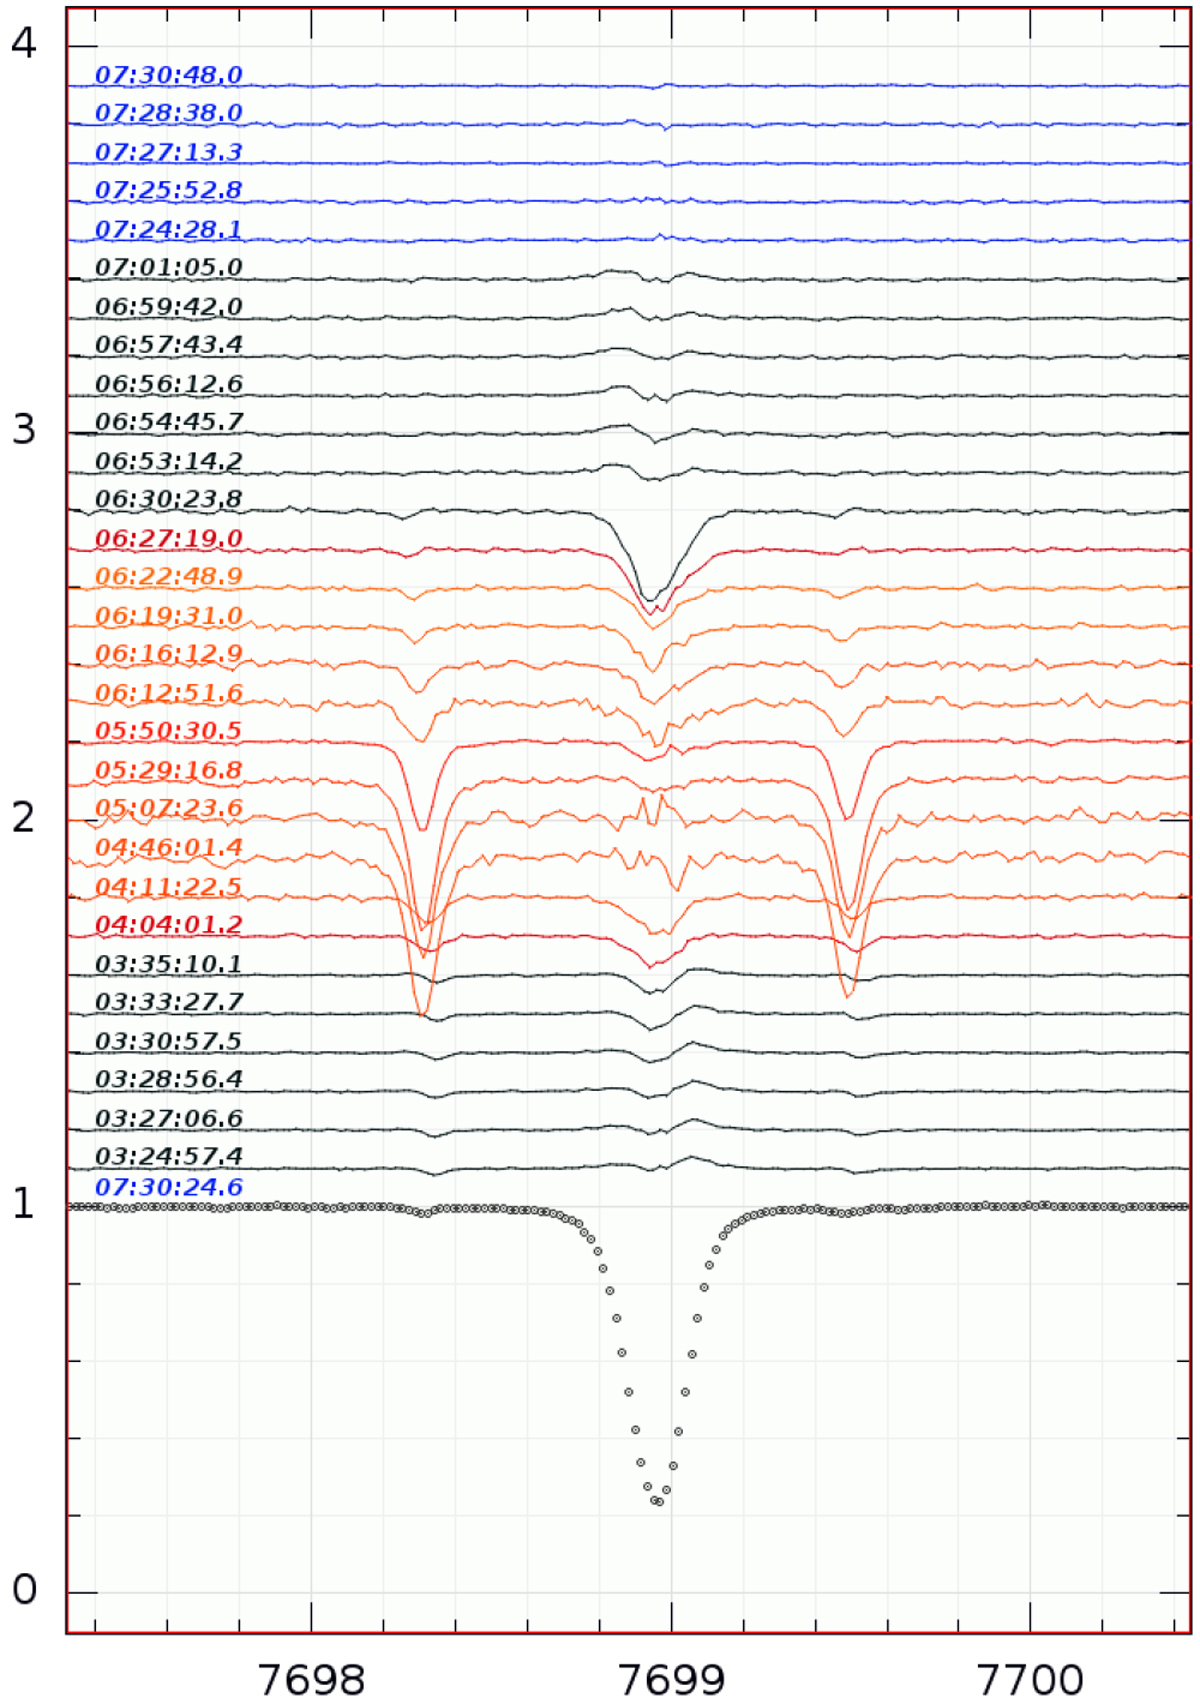
Same as Fig. 9, but for the K I λ7699-Å line. We note that the excess absorption in the line core is probably seen at all eclipse phases maybe with the exception of the exact mid eclipse at around UT 5:07 (which is the noisiest spectrum of all though). The two tiny lines symmetric around K I, at λ7698.304 Å and 7699.486 Å, are two water-vapor lines that became dramatically stronger during umbral eclipse. The out-of-eclipse spectrum is now plotted with dots to additionally show the CCD pixel sampling of PEPSI in its R = 130 000 mode.
Current usage metrics show cumulative count of Article Views (full-text article views including HTML views, PDF and ePub downloads, according to the available data) and Abstracts Views on Vision4Press platform.
Data correspond to usage on the plateform after 2015. The current usage metrics is available 48-96 hours after online publication and is updated daily on week days.
Initial download of the metrics may take a while.