Fig. 4.
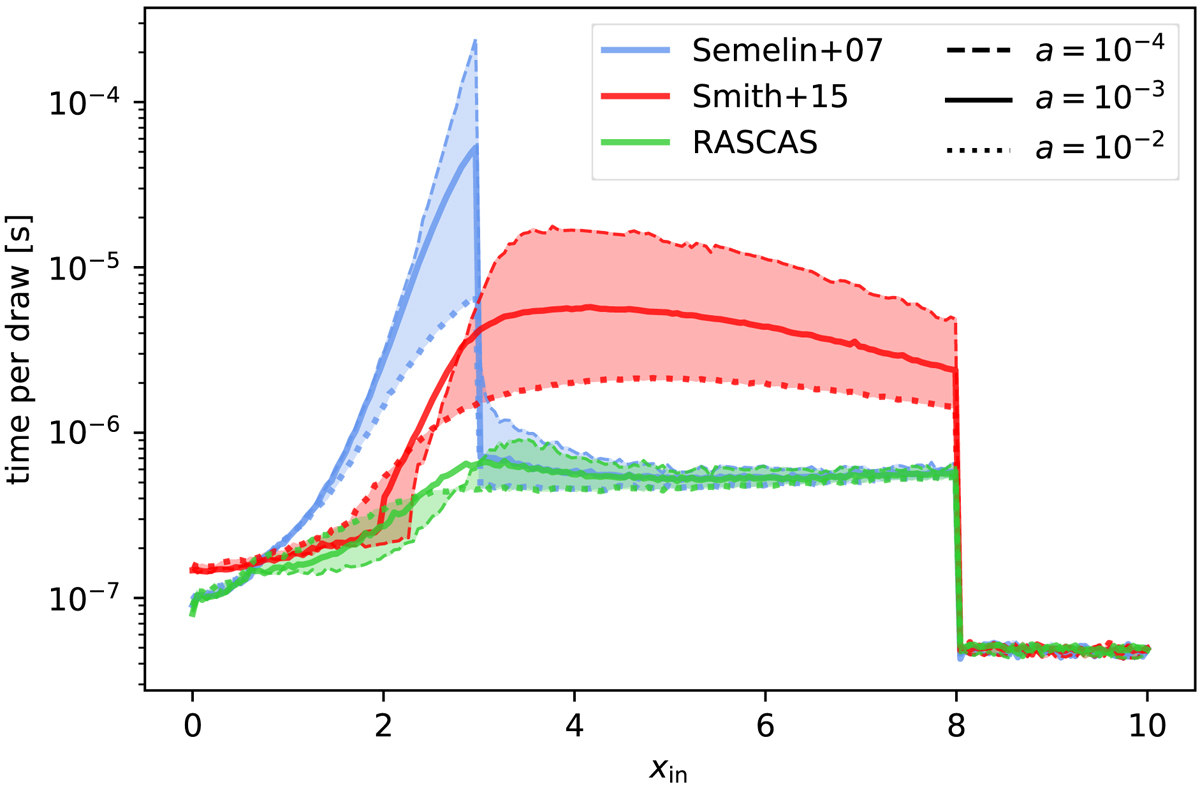
Measured performance of our draws of u∥ in terms of CPU time per draw vs. input frequency xin. The methods of Semelin et al. (2007) and Smith et al. (2015) are shown in blue and red, while our approach is shown in green. The solid lines are obtained with a = 10−3, while the dotted and dashed lines correspond to a = 10−2 and a = 10−4. The shaded areas indicate the area between these two curves. The non-monotonic behaviour of CPU cost with a for our method and that of Smith et al. (2015) can be seen: at low xin, low a values are the cheapest, while at high xin, low a values are the most expensive draws.
Current usage metrics show cumulative count of Article Views (full-text article views including HTML views, PDF and ePub downloads, according to the available data) and Abstracts Views on Vision4Press platform.
Data correspond to usage on the plateform after 2015. The current usage metrics is available 48-96 hours after online publication and is updated daily on week days.
Initial download of the metrics may take a while.