Fig. 2.
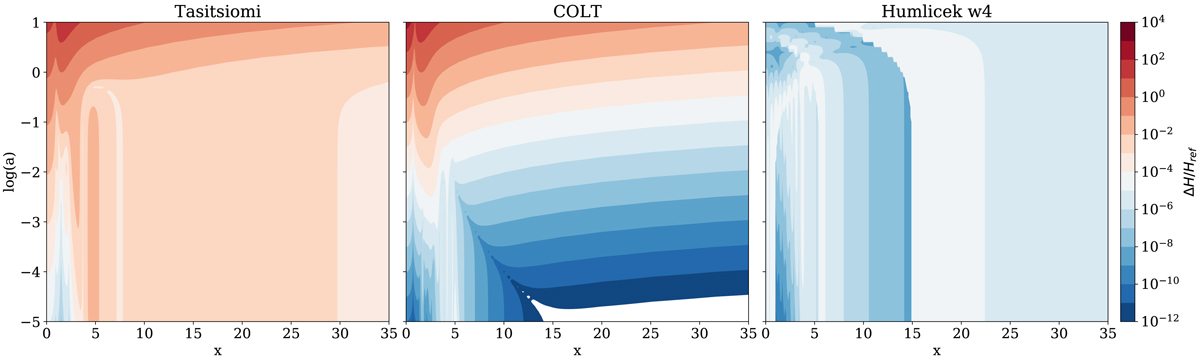
Contour plot of the relative errors of the three approximations for the Voigt function implemented in RASCAS. Left: approximation from Tasitsiomi (2006). Middle: approximation from Smith et al. (2015). Right: W4 approximation from Humlíček (1982). Bluer means more accurate, while redder means less accurate. White parts have a relative error better than 10−12. The transition between light blue and light red is at 10−4.
Current usage metrics show cumulative count of Article Views (full-text article views including HTML views, PDF and ePub downloads, according to the available data) and Abstracts Views on Vision4Press platform.
Data correspond to usage on the plateform after 2015. The current usage metrics is available 48-96 hours after online publication and is updated daily on week days.
Initial download of the metrics may take a while.