Fig. 11.
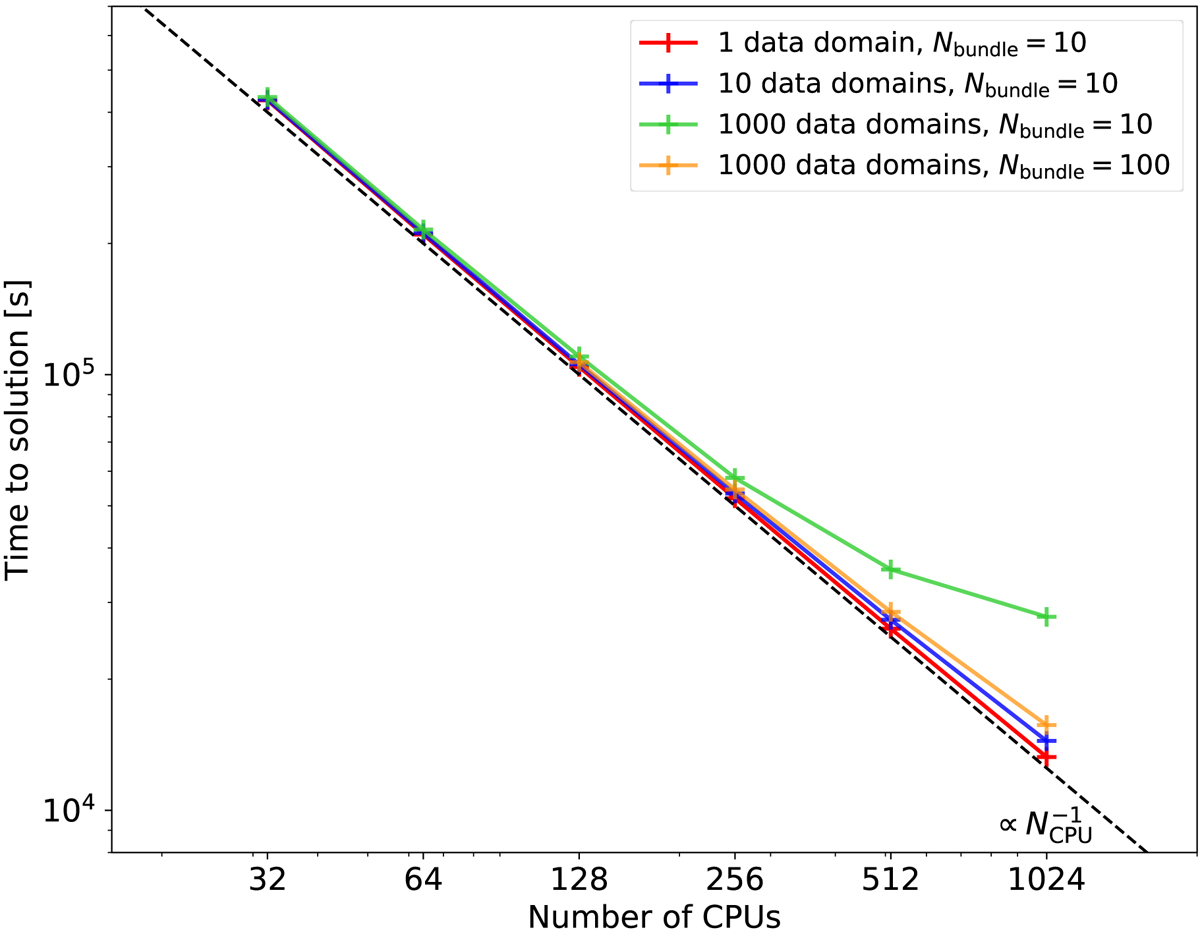
Scaling test of RASCAS based on an idealised galactic disc simulation: total elapsed time for a realistic MCRT experiment as a function of the number of CPUs used for the run. Red symbols show the results for the series where the computational domain is decomposed into one single data domain, whereas the blue crosses (respectively green crosses) are for the case where the computational domain is decomposed into 10 (resp. 1000) data domains. These three simulations were run with Nbundle = 10. Orange crosses again show the case where the computational domain is decomposed into 1000 data domains, but this time using Nbundle = 100. To guide the eye, the dashed line shows the ideal case of relation ![]() .
.
Current usage metrics show cumulative count of Article Views (full-text article views including HTML views, PDF and ePub downloads, according to the available data) and Abstracts Views on Vision4Press platform.
Data correspond to usage on the plateform after 2015. The current usage metrics is available 48-96 hours after online publication and is updated daily on week days.
Initial download of the metrics may take a while.