Fig. 8.
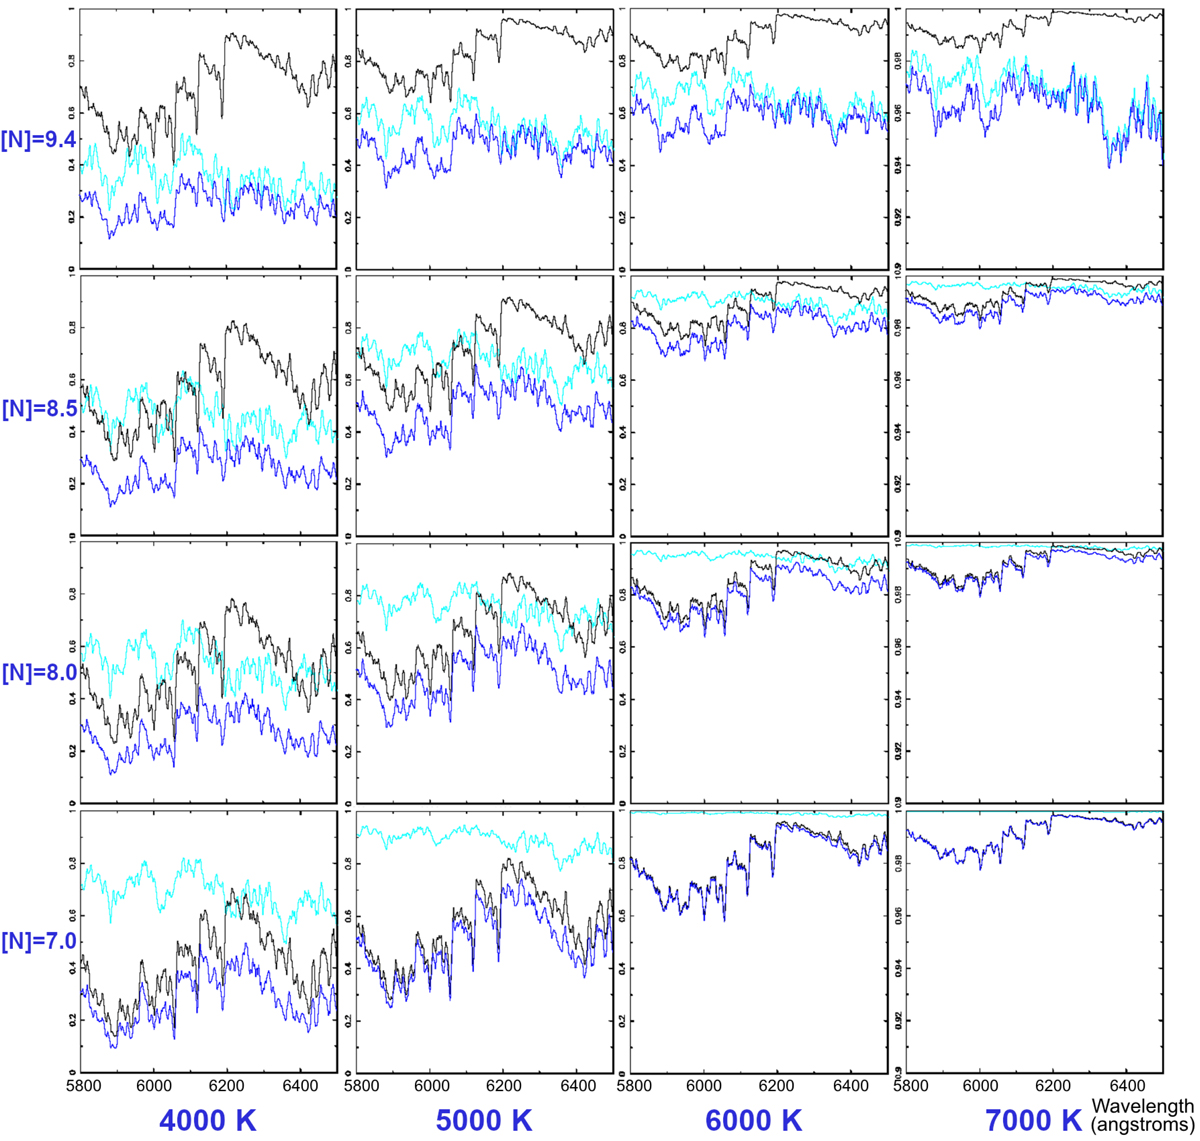
Hydrogen-deficient synthetic spectra between 5800 and 6400 Å for four different nitrogen abundances (7.0 ≤ [N] ≤ 9.4 dex) and four different Teffs (4000 to 7000 K). The spectra are normalised to unity. The intensity scales extend between 0 and 1 for all spectra except the ones with a Teff of 7000 K whose intensity scales are between 0.9 and 1. Cyan represents the CN band-head features, black represents the C2 bands, and blue is the sum of both. The abundances used for the models are those of a classical RCB star, i.e. [H] = 7.5, [He] = 11.5, [C] = 9.0 and [O] = 8.8, and the C/N ratio increased (∼0.4, ∼3.0, 10, and 100) by decreasing the nitrogen abundances.
Current usage metrics show cumulative count of Article Views (full-text article views including HTML views, PDF and ePub downloads, according to the available data) and Abstracts Views on Vision4Press platform.
Data correspond to usage on the plateform after 2015. The current usage metrics is available 48-96 hours after online publication and is updated daily on week days.
Initial download of the metrics may take a while.