Fig. 5.
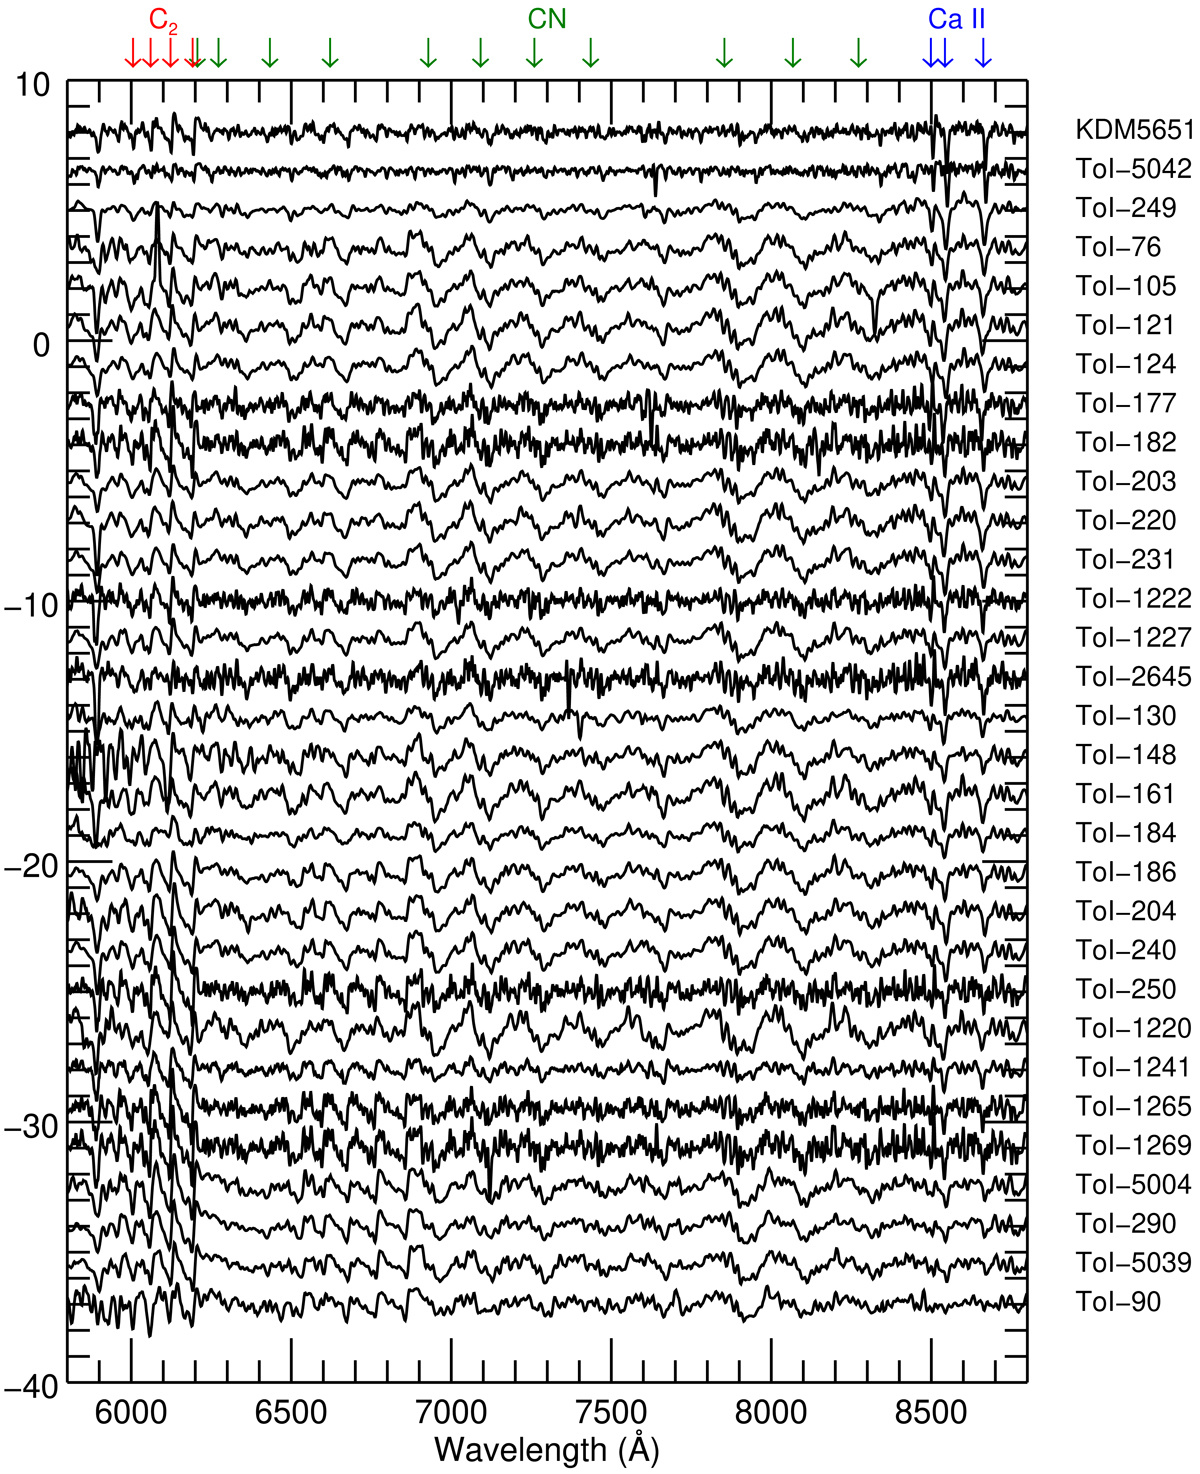
Spectra, red region from 5800 to 8800 Å, of KDM 5651 and the 30 newly discovered Galactic Cold RCB stars. The underlying blackbody curves were removed. We plot them in order of the Ca II IR triplet strength, from stronger to weaker lines (top to bottom), that is, in decreasing order of Teff. The spectra were smoothed (5 points were used) for a better presentation and comparison. The names of the corresponding stars are given on the right side. The ordinate is arbitrary.
Current usage metrics show cumulative count of Article Views (full-text article views including HTML views, PDF and ePub downloads, according to the available data) and Abstracts Views on Vision4Press platform.
Data correspond to usage on the plateform after 2015. The current usage metrics is available 48-96 hours after online publication and is updated daily on week days.
Initial download of the metrics may take a while.