Fig. 4.
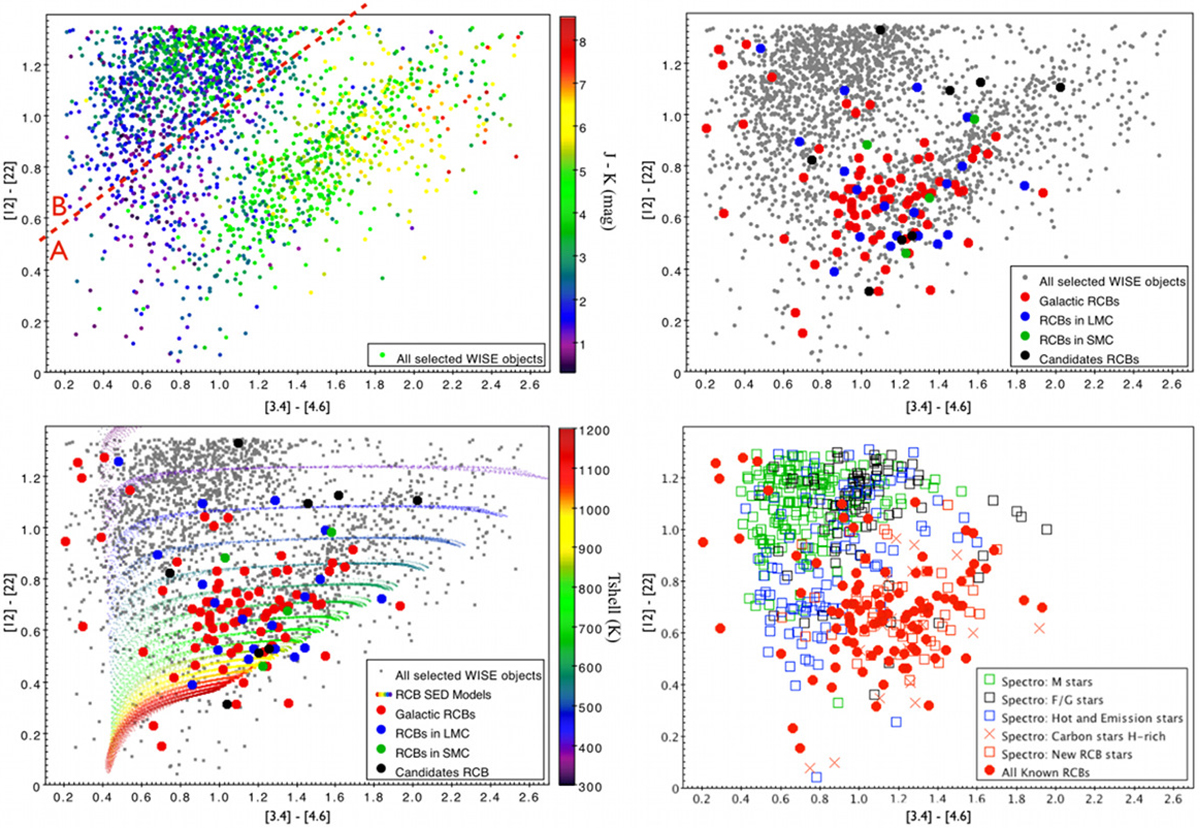
Colour–colour [3.4]−[4.6] versus [12]−[22] diagrams. Top-left: distribution of all selected WISE targets of interest that have a valid measurement in all four WISE bands. The diagram is colour-coded with the J − K colour index. Two groups of objects are emerging; we are separating them pragmatically into two zones, A and B (see text for more details). Top-right: same sample of objects is represented in grey, while all known and candidate RCB stars are overlaid with large dots. Most RCB stars are located in zone A. Bottom-left: same diagram as the preceding except that the RCB SED models are added, colour coded with their shell temperatures. Bottom-right: here all known RCB stars are represented again by large red dots, while the large squares represent all the targets of interest that have already been followed-up spectroscopically. They are colour-coded respective to their spectral classifications.
Current usage metrics show cumulative count of Article Views (full-text article views including HTML views, PDF and ePub downloads, according to the available data) and Abstracts Views on Vision4Press platform.
Data correspond to usage on the plateform after 2015. The current usage metrics is available 48-96 hours after online publication and is updated daily on week days.
Initial download of the metrics may take a while.