Fig. 1.
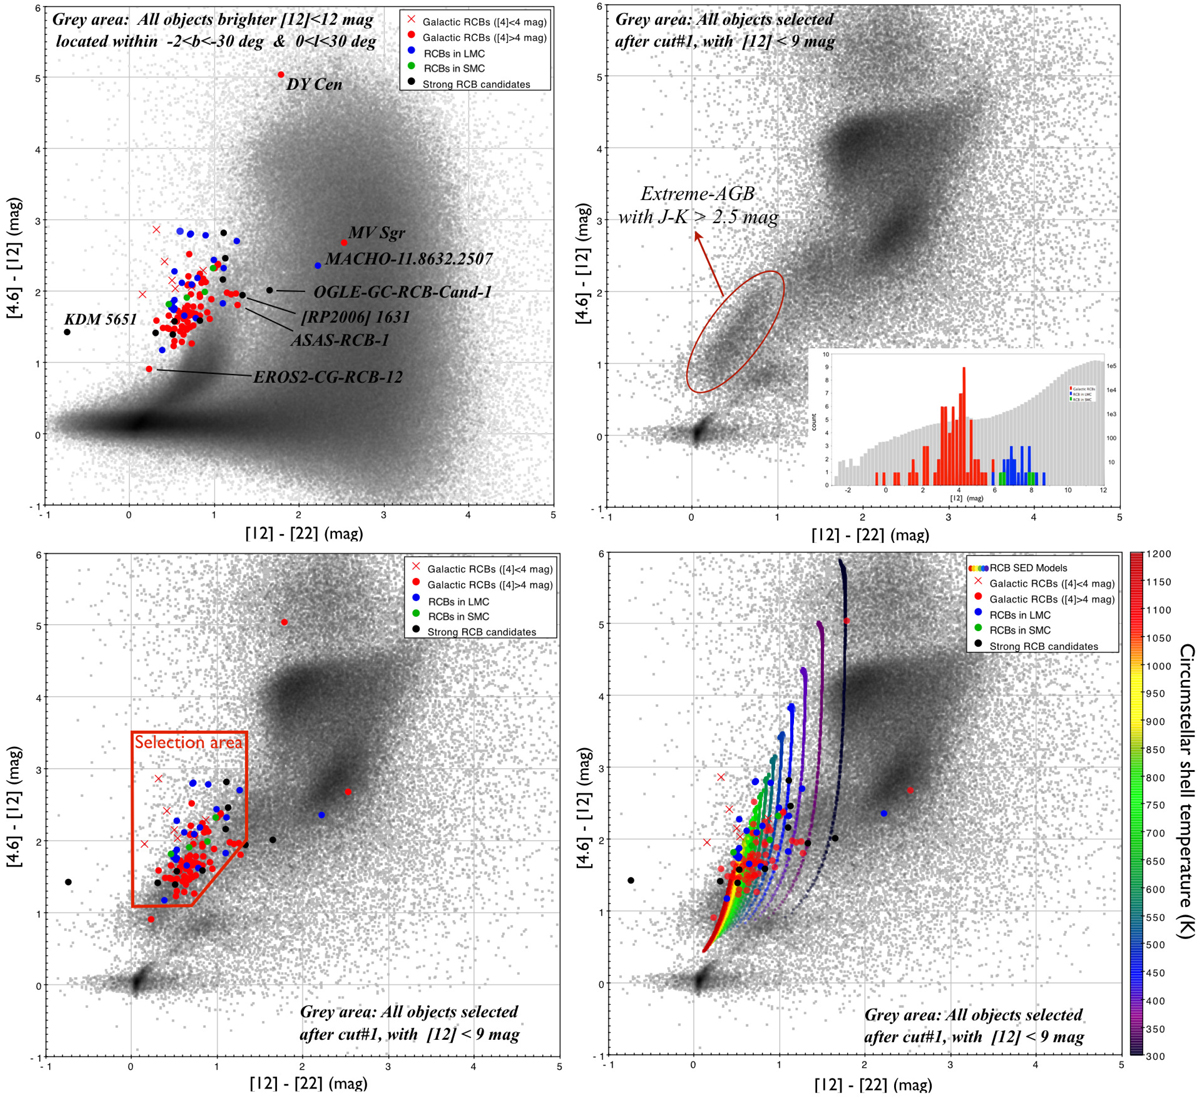
Four panels representing the same colour–colour [4.6]−[12] versus [12]−[22] diagram for different WISE source subsamples. See the explanations in the text and within the figures. The [12] magnitude distribution represented inside the top-right panel corresponds to the known RCB stars (linear scale, coloured bins: red for Galactic, blue for LMC, green for SMC) and to the WISE objects selected after cut #0 (grey bins, logarithmic scale). The names and positions of all known and candidate RCB stars that were rejected by the criterion cut #2 are indicated on the top-left panel.
Current usage metrics show cumulative count of Article Views (full-text article views including HTML views, PDF and ePub downloads, according to the available data) and Abstracts Views on Vision4Press platform.
Data correspond to usage on the plateform after 2015. The current usage metrics is available 48-96 hours after online publication and is updated daily on week days.
Initial download of the metrics may take a while.