Fig. 9.
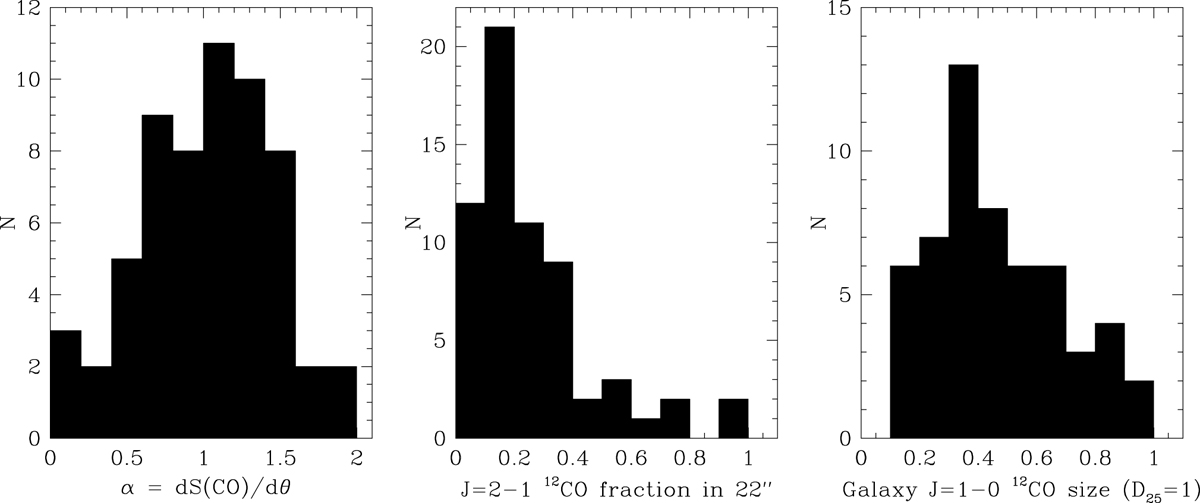
Distributions of the sample galaxies as a function of (left) slope α, marking the change in measured J = 1−0 CO flux as a function of increasing observing beam size, (center) the fraction f22 of the extrapolated total galaxy CO flux detected in a 22″ beam, and (right) the extrapolated galaxy CO size as a fraction of the optical size (D25) (see text).
Current usage metrics show cumulative count of Article Views (full-text article views including HTML views, PDF and ePub downloads, according to the available data) and Abstracts Views on Vision4Press platform.
Data correspond to usage on the plateform after 2015. The current usage metrics is available 48-96 hours after online publication and is updated daily on week days.
Initial download of the metrics may take a while.