Fig. 14.
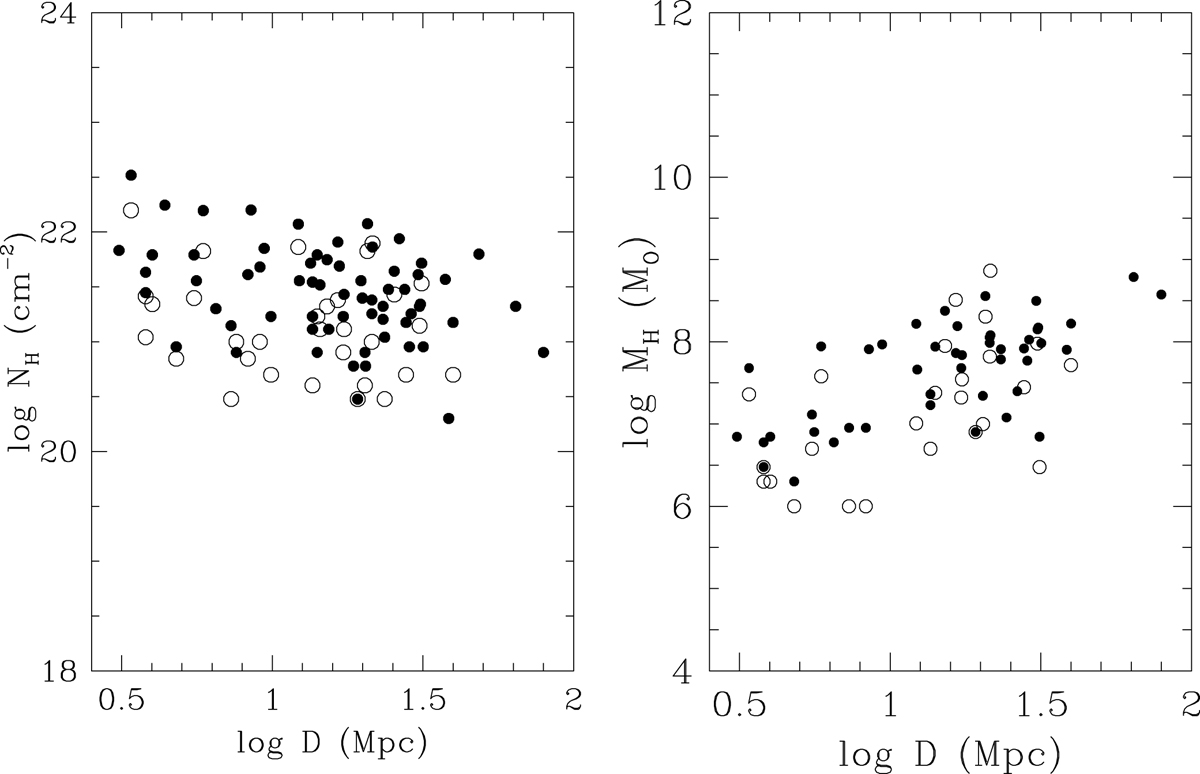
Calculated beam-averaged column densities NH (left) and central gas masses MH (right) as a function of distance D. Filled circles: Values based on the preferred “nominal” carbon abundance. Open circles: Values bases on extrapolated maximum carbon abundances (see text). All values are based on an assumed isotopological ratio of 40.
Current usage metrics show cumulative count of Article Views (full-text article views including HTML views, PDF and ePub downloads, according to the available data) and Abstracts Views on Vision4Press platform.
Data correspond to usage on the plateform after 2015. The current usage metrics is available 48-96 hours after online publication and is updated daily on week days.
Initial download of the metrics may take a while.