Free Access
Fig. 1.
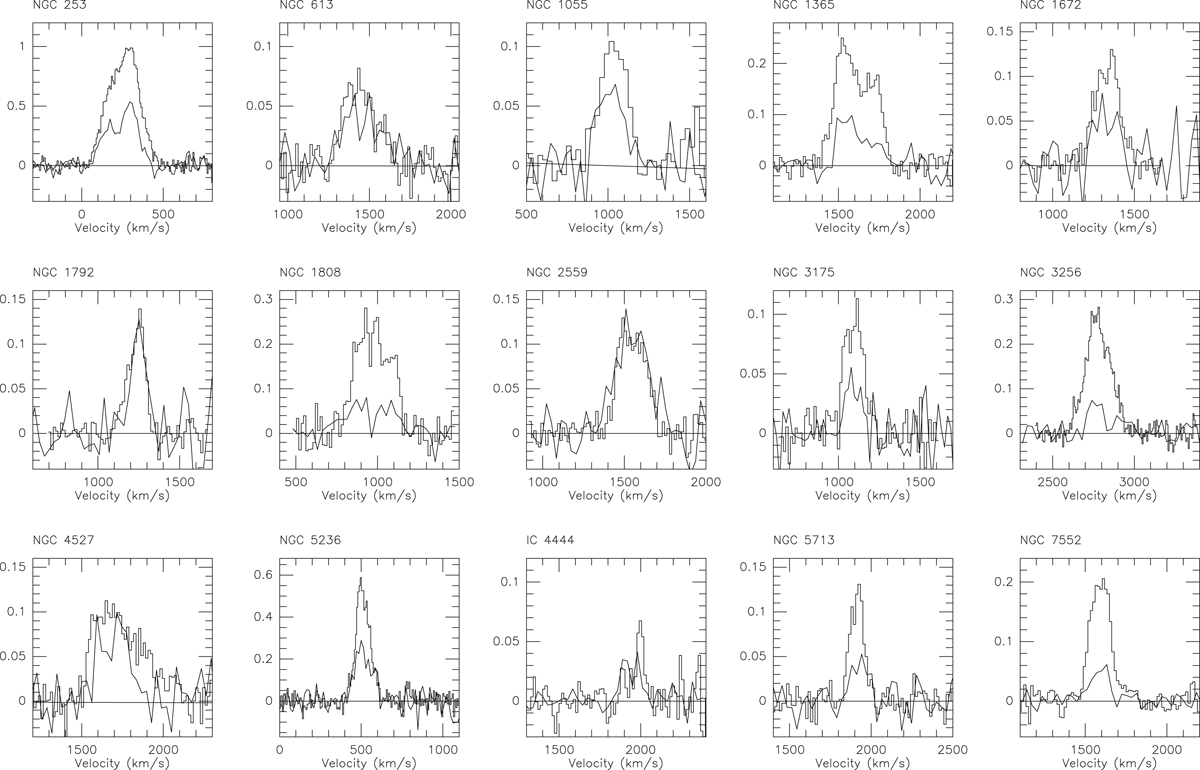
Sample of SEST J = 1−0 CO observations of galaxy centers, showing 12CO (histogram) and superposed 13CO (continuous lines) profiles; the intensities of the latter have been multiplied by a factor 5. Intensities are in ![]() (K). Velocities are V(LSR) in km s−1. Galaxies are identified at the top.
(K). Velocities are V(LSR) in km s−1. Galaxies are identified at the top.
Current usage metrics show cumulative count of Article Views (full-text article views including HTML views, PDF and ePub downloads, according to the available data) and Abstracts Views on Vision4Press platform.
Data correspond to usage on the plateform after 2015. The current usage metrics is available 48-96 hours after online publication and is updated daily on week days.
Initial download of the metrics may take a while.