Fig. 1
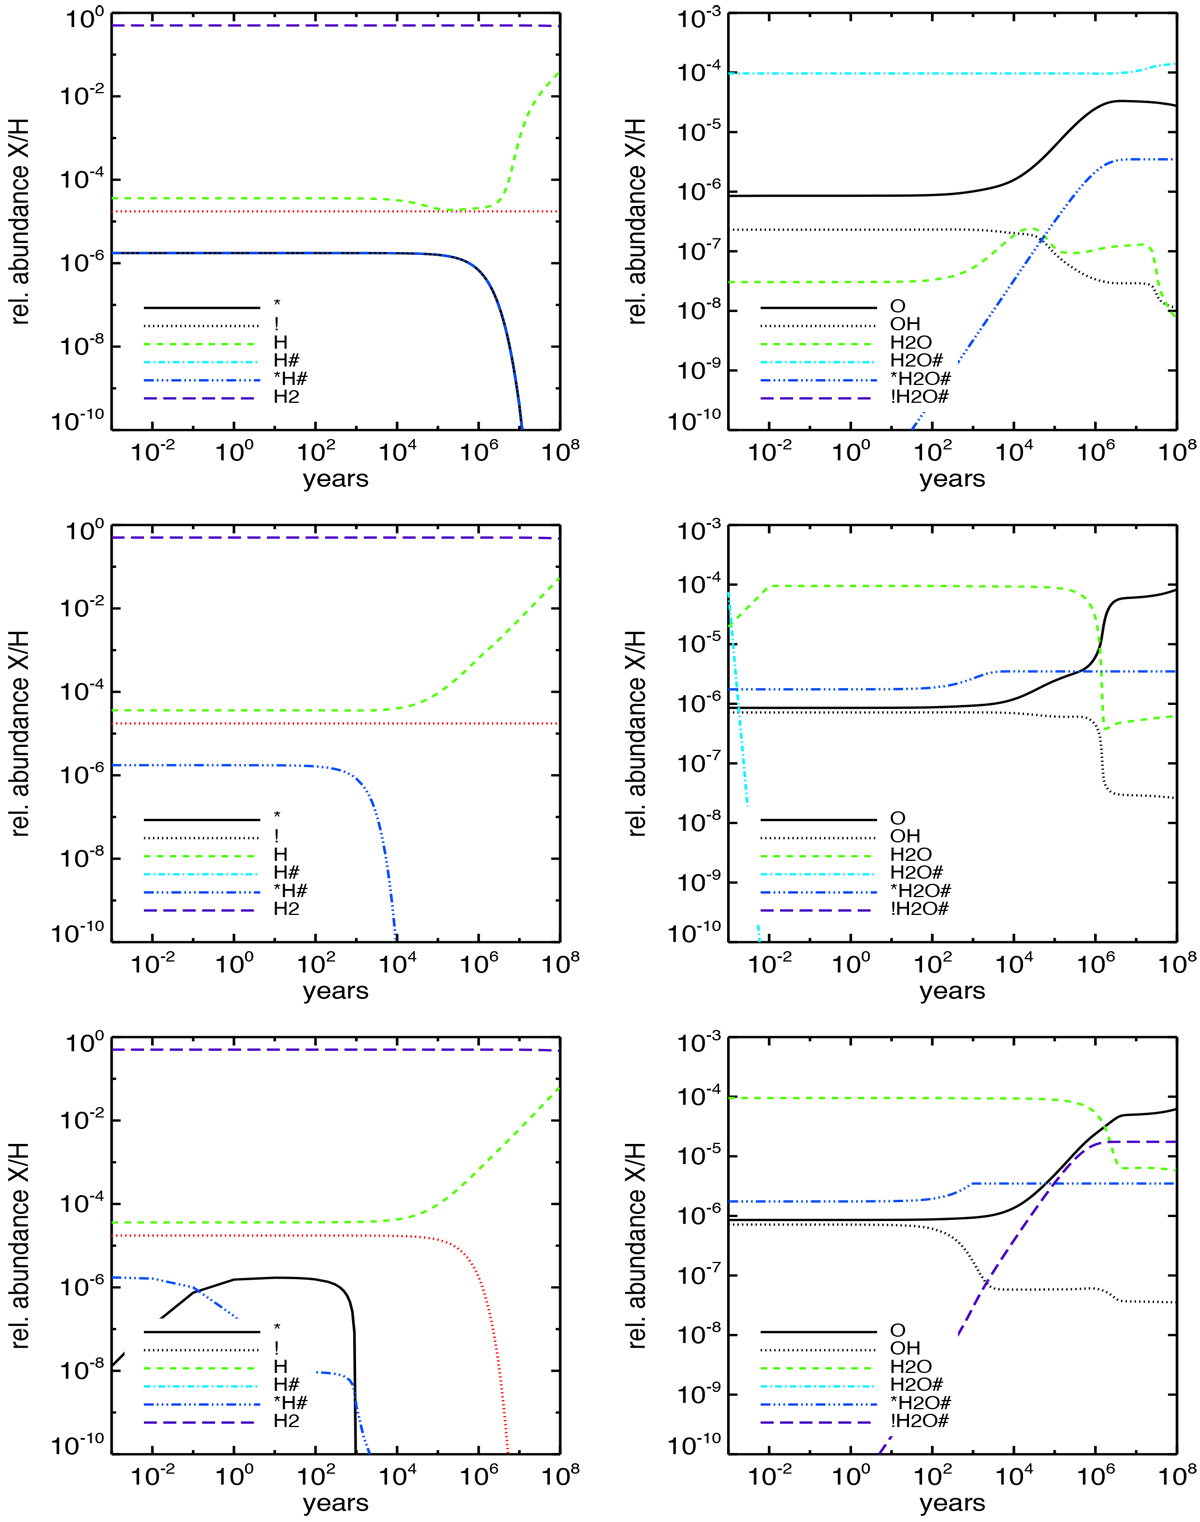
Species abundances as function of time at 50 (top panels), 150 (middle panels), and 250 K (bottom panels). The abundance of unoccupied silicate surface (*) and core (!) sites, of atomic hydrogen in the gas and solid phases, and of H2 are shown in the left panels. Gas-phase water and water ice abundances are shown on the right panels together with gas-phase abundance of atomic oxygen and OH.
Current usage metrics show cumulative count of Article Views (full-text article views including HTML views, PDF and ePub downloads, according to the available data) and Abstracts Views on Vision4Press platform.
Data correspond to usage on the plateform after 2015. The current usage metrics is available 48-96 hours after online publication and is updated daily on week days.
Initial download of the metrics may take a while.