Free Access
Fig. 13.
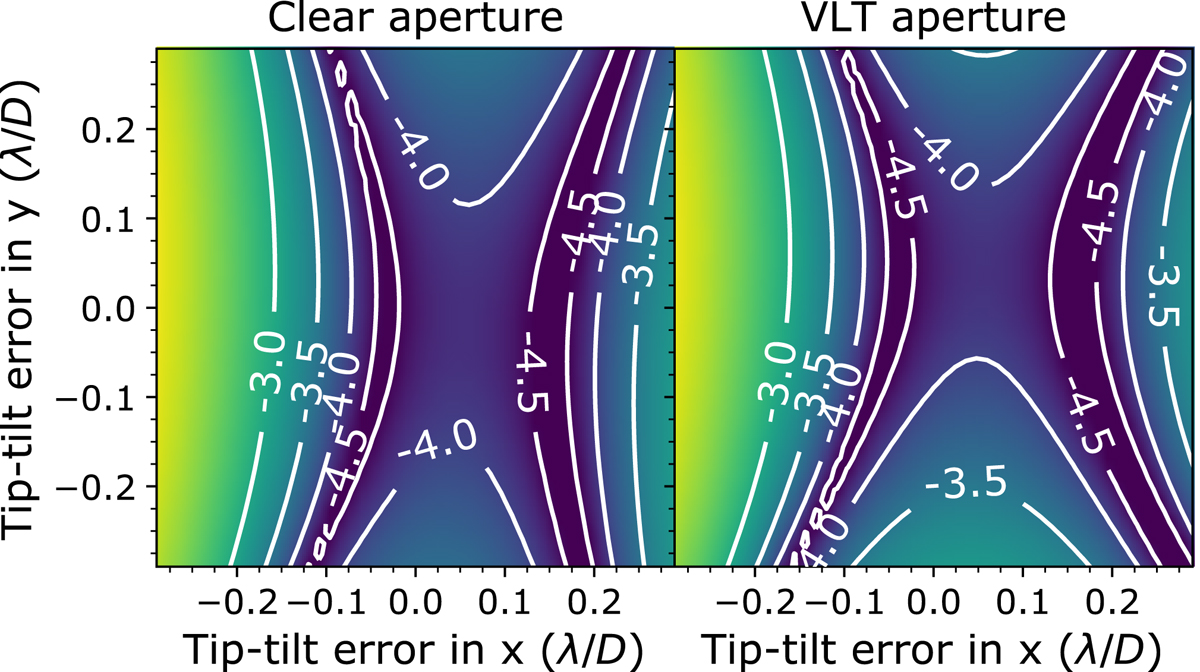
Map of the worst contrast through an off-axis fiber over a 10% bandwidth as a function of tip-tilt error upstream of the microlens array. This shows that the coronagraph is reasonably stable against tip-tilt, allowing for a ∼0.15λ/D tip-tilt error until the contrast drops to 10−4. The contour labels indicate log10(ηs/ηp).
Current usage metrics show cumulative count of Article Views (full-text article views including HTML views, PDF and ePub downloads, according to the available data) and Abstracts Views on Vision4Press platform.
Data correspond to usage on the plateform after 2015. The current usage metrics is available 48-96 hours after online publication and is updated daily on week days.
Initial download of the metrics may take a while.