Fig. 9
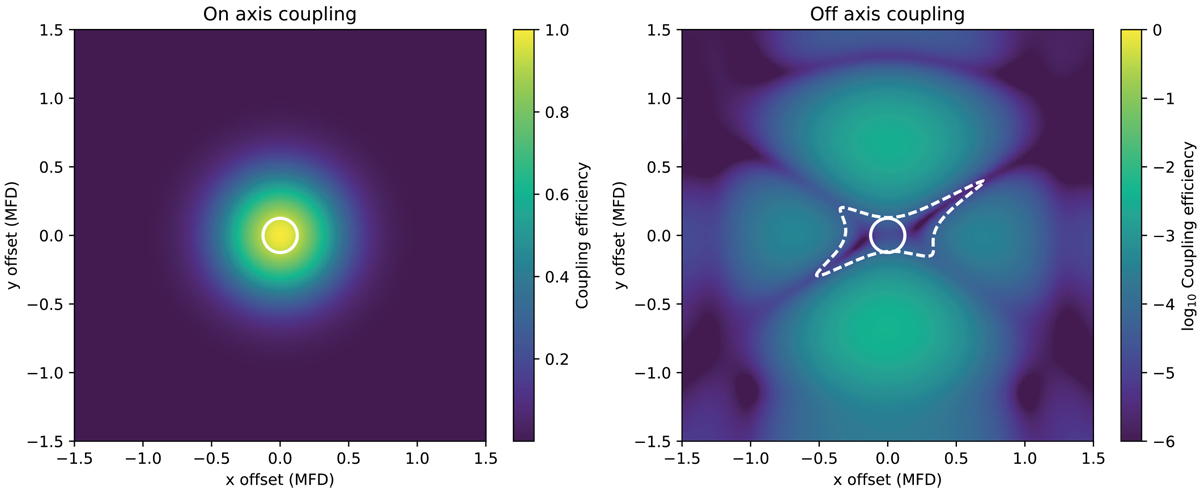
Left panel: throughput of an on-axis source as function of fiber misalignment. Right panel: off-axis contrast as function of misalignment. The white contour encircles the area where the contrast is below 1 × 10⁻⁴. The white circle is the largest circle that fits within the contour with a radius of 1/8th of the mode field diameter.
Current usage metrics show cumulative count of Article Views (full-text article views including HTML views, PDF and ePub downloads, according to the available data) and Abstracts Views on Vision4Press platform.
Data correspond to usage on the plateform after 2015. The current usage metrics is available 48-96 hours after online publication and is updated daily on week days.
Initial download of the metrics may take a while.