Fig. 7
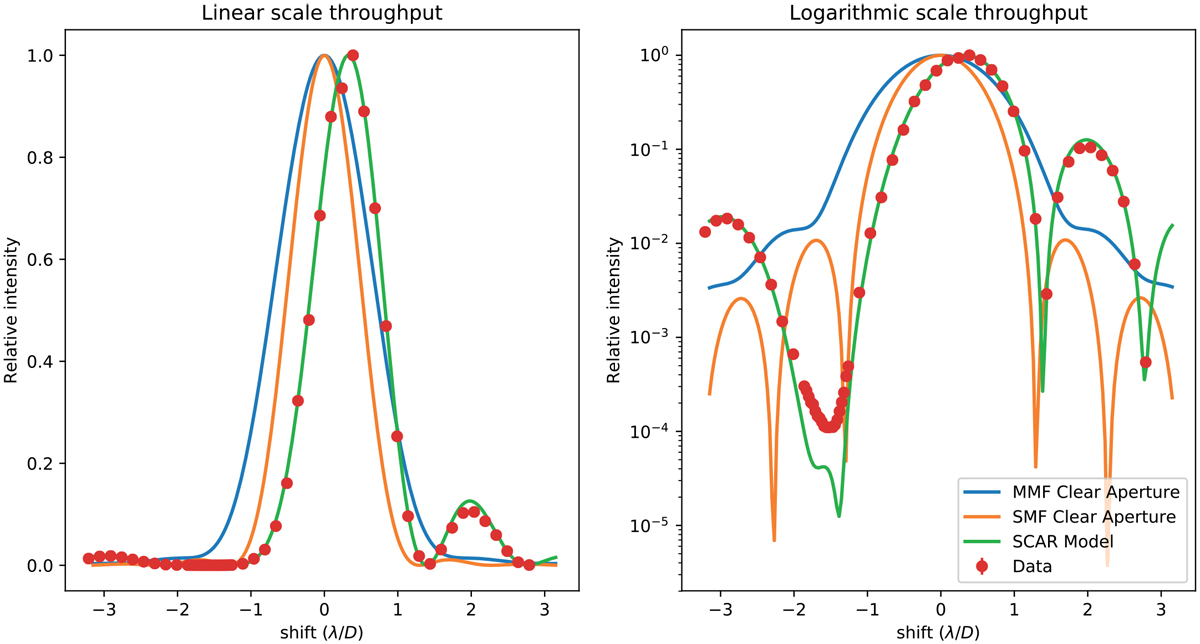
Left panel: relative throughput on a linear scale as function of relative shift with respect to the microlens center. The green points are the measurements. Errorbars are included but are smaller than the size of the plotting symbols. The errorbars are very small and show that random errors cannot explain the difference between the model and the measurements. The orange line shows the nonfitted model of this SCAR design. Right panel: throughput on a logarithmic scale. The deepest contrast that we reach is 1.15 × 10⁻⁴. The throughput curve is also flat between −1.6 and −1.4λ∕D. The measured null does not reach the design null due to residual low order aberrations on the order of 10 nm rms. The blue curve shows the amount of light that falls in a microlens of a clear aperture, which shows the contrast without SCAR. This is comparable to the raw contrast curve for normal imaging or using a multi-mode fiber. The orange line shows the normalized throughput with an unobstructed aperture and a SMF. The SMF shows a gain compared to the MMF.
Current usage metrics show cumulative count of Article Views (full-text article views including HTML views, PDF and ePub downloads, according to the available data) and Abstracts Views on Vision4Press platform.
Data correspond to usage on the plateform after 2015. The current usage metrics is available 48-96 hours after online publication and is updated daily on week days.
Initial download of the metrics may take a while.