Fig. 4
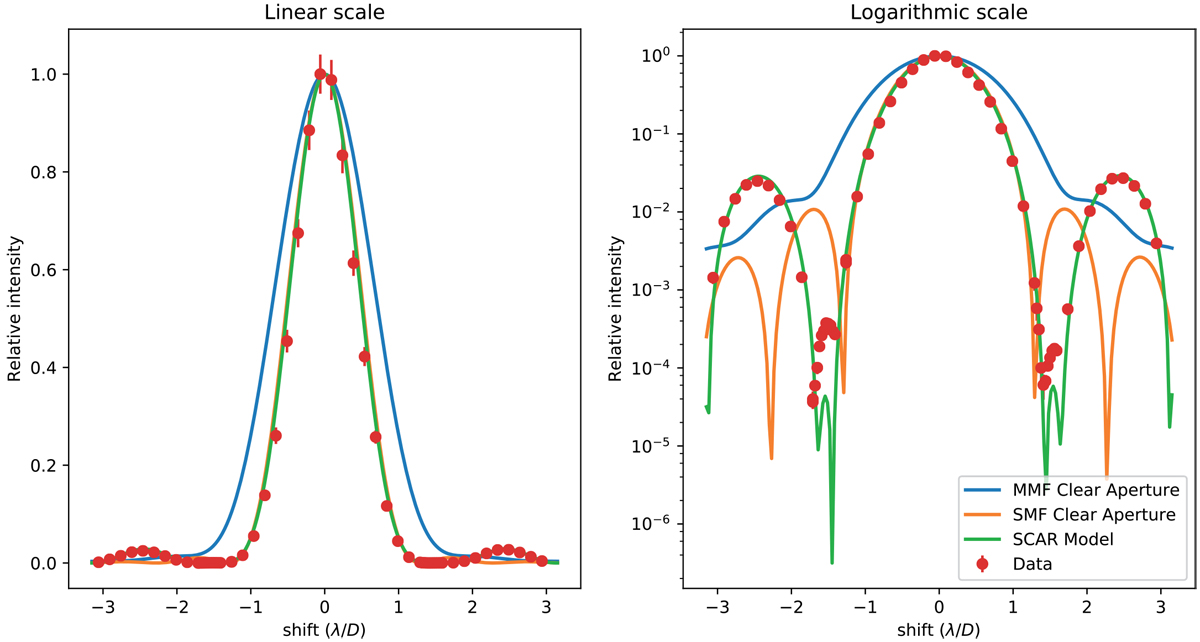
Left panel: relative throughput on a linear scale as function of relative shift with respect to the microlens center. The red points are the measurements with errorbars due to random errors. The green line shows the model of this SCAR design. Right panel: throughput on a logarithmic scale. The null is uneven between left and right and not as deep as designed. This is suspected to be caused by 10 nm rms residual low-order aberrations. The blue line shows the amount of light thatfalls on the microlens with a clear aperture and without SCAR. This is comparable to the contrast curve for normal imaging or using a multi-mode fiber. The orange line shows the normalized throughput with a unobstructed aperture and a SMF. The SMF shows a gain compared to the MMF.
Current usage metrics show cumulative count of Article Views (full-text article views including HTML views, PDF and ePub downloads, according to the available data) and Abstracts Views on Vision4Press platform.
Data correspond to usage on the plateform after 2015. The current usage metrics is available 48-96 hours after online publication and is updated daily on week days.
Initial download of the metrics may take a while.