Fig. 11
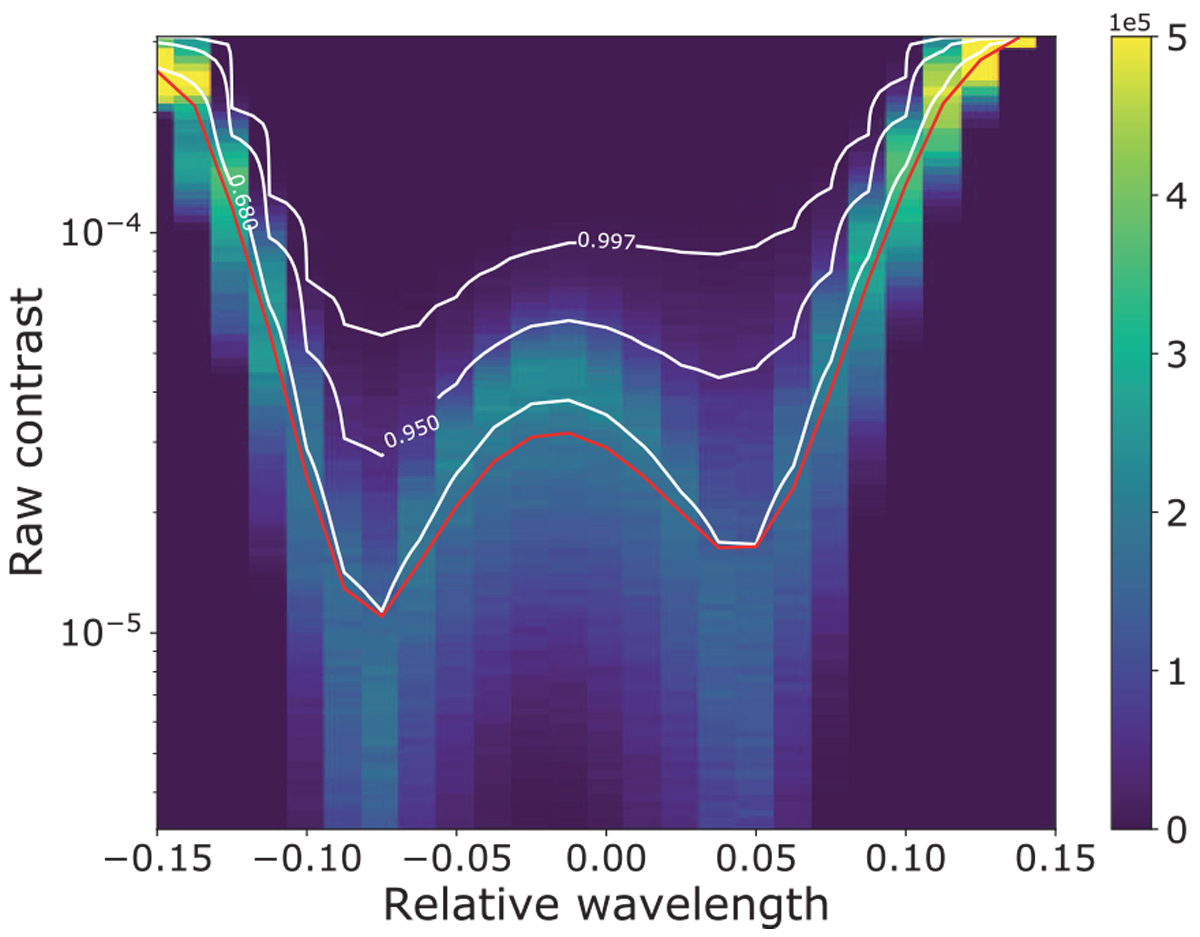
Results of the Monte Carlo tolerance analysis as function of wavelength. The red curve shows the expectation value of the contrast. The white curves are the 0.68, 0.95 and 0.997 percentile confidence limits. The analysis indicates that within specified tolerances a contrast below 1 × 10⁻⁴ can be reached over a 15 percent bandwidth. Within the full 20 percent bandwidth the contrast is below 2 × 10⁻⁴.
Current usage metrics show cumulative count of Article Views (full-text article views including HTML views, PDF and ePub downloads, according to the available data) and Abstracts Views on Vision4Press platform.
Data correspond to usage on the plateform after 2015. The current usage metrics is available 48-96 hours after online publication and is updated daily on week days.
Initial download of the metrics may take a while.