Fig. 3.
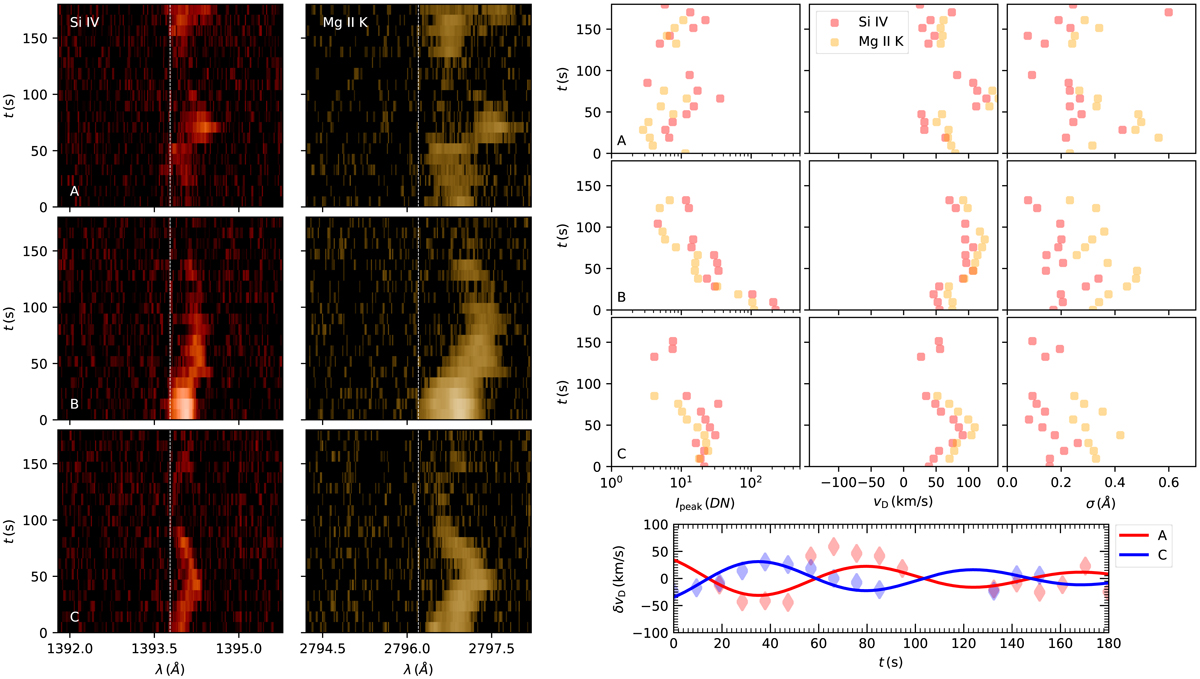
Left: evolution of Si IV and Mg II K line profiles during the initial surge phase at the three points A, B, and C shown in Fig. 2 corresponding to the top edge of the surge, surge centre, and bottom edge of the surge, respectively. Left: wavelength-time plot for Si IV (red) and Mg II K (orange) spectra during the initial 180 s when the surge material is detectable in the SG data, starting at 16:12:36. Top right: evolution of the parameters of the line profiles fitted with a single peak Gaussian. The scatter plots correspond to the peak intensity, Doppler velocity, and line width at points A, B, and C. We omit instances in which the profiles could not be fitted reliably. Bottom right: evolution of the line-of-sight velocities at the opposite edges of the flux tube fitted to detrended Si IV spectra.
Current usage metrics show cumulative count of Article Views (full-text article views including HTML views, PDF and ePub downloads, according to the available data) and Abstracts Views on Vision4Press platform.
Data correspond to usage on the plateform after 2015. The current usage metrics is available 48-96 hours after online publication and is updated daily on week days.
Initial download of the metrics may take a while.