Fig. 6.
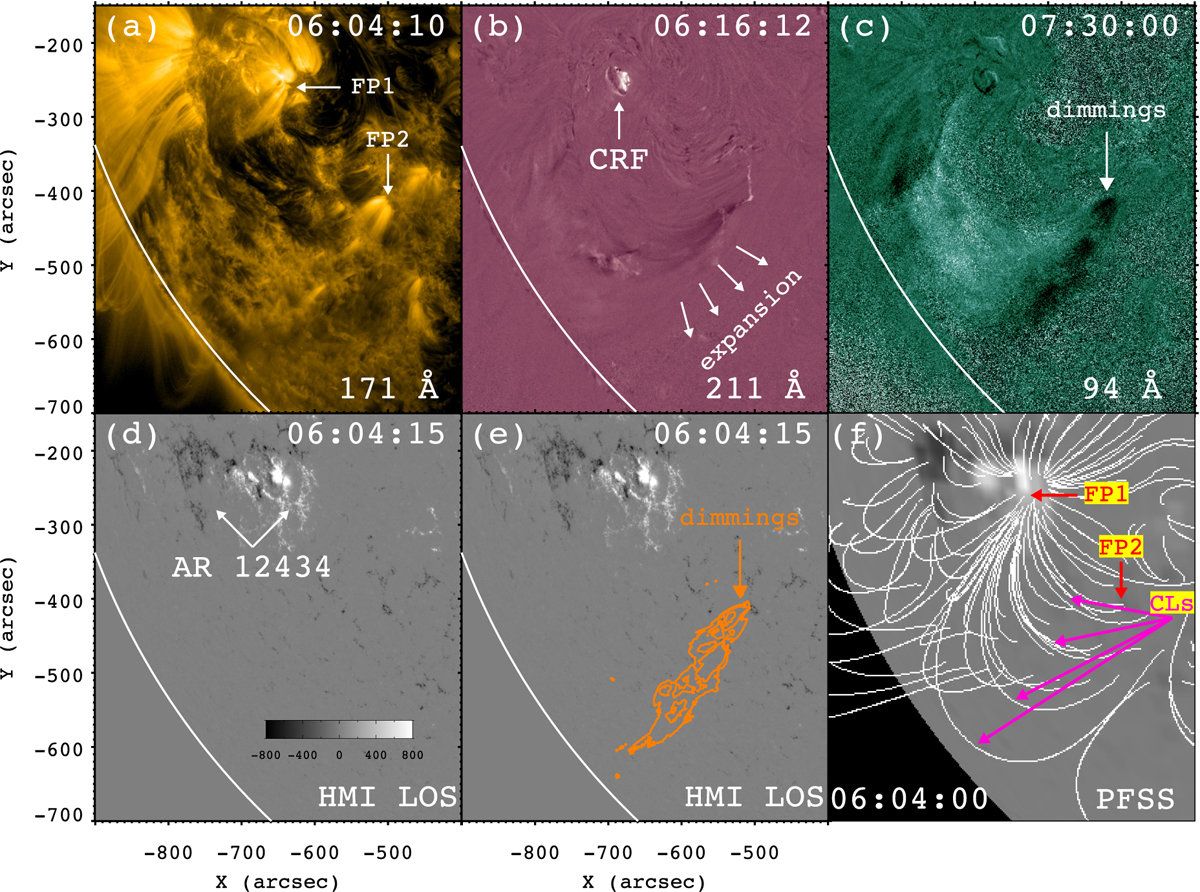
Panel a: original AIA 171 Å image. The white arrows point to the footpoints of the large-scale, overlying CLs. Panels b,c: base-ratio images in 211 Å and 94 Å. Panels d,e: LOS magnetogram, which is superposed by intensity contours of 193 Å image in Fig. 4e. Panel f: global magnetic fields obtained from the PFSS modeling. The evolution of remote coronal dimmings in 211 Å and 94 Å is shown in a movie (anim3.mov) available online.
Current usage metrics show cumulative count of Article Views (full-text article views including HTML views, PDF and ePub downloads, according to the available data) and Abstracts Views on Vision4Press platform.
Data correspond to usage on the plateform after 2015. The current usage metrics is available 48-96 hours after online publication and is updated daily on week days.
Initial download of the metrics may take a while.