Free Access
Fig. 2.
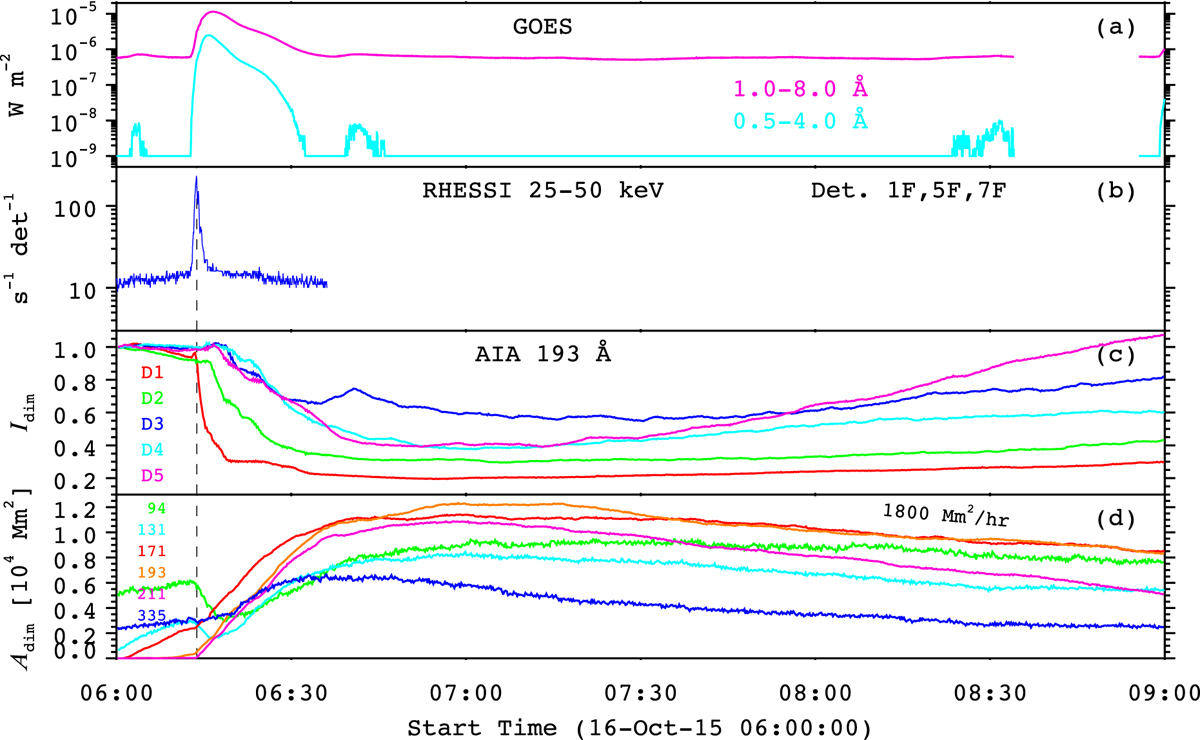
Panel a: GOES light curves of the flare. Panel b: HXR light curve at 25−50 keV. Panel c: evolutions of the average intensities of “D1”–“D5” in Fig. 4e. Panel d: time evolutions of the total area of remote dimmings in different wavelengths. The black dashed line denotes the time at 06:13:48 UT.
Current usage metrics show cumulative count of Article Views (full-text article views including HTML views, PDF and ePub downloads, according to the available data) and Abstracts Views on Vision4Press platform.
Data correspond to usage on the plateform after 2015. The current usage metrics is available 48-96 hours after online publication and is updated daily on week days.
Initial download of the metrics may take a while.