Fig. B.1.
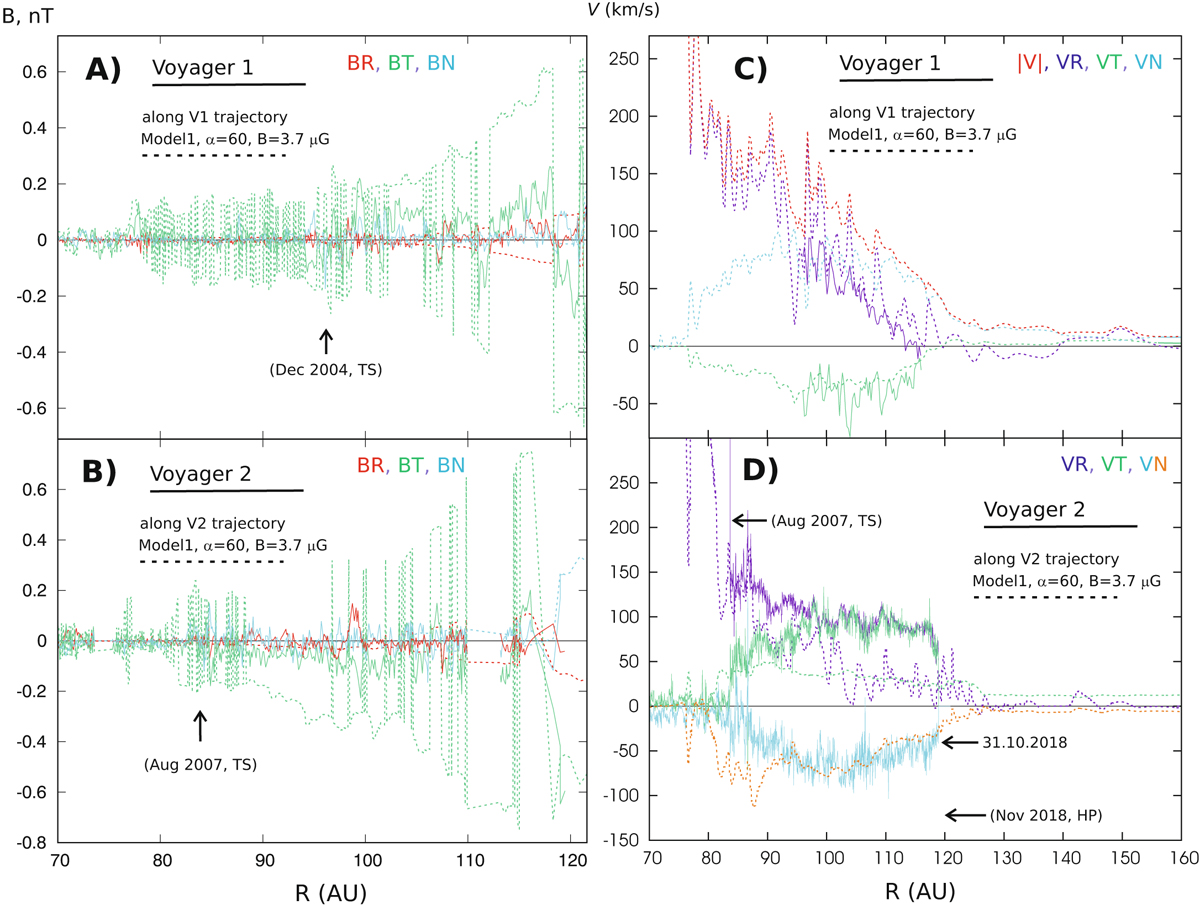
Components of the magnetic field (panels A and B) and plasma velocity (panels C and D) in RTN coordinate system along the Voyager 1 (top panels) and Voyager 2 (bottom panels) trajectories in the inner heliosheath. Results of Model 1 are shown as dashed curves. Solid curves represent Voyager 1/MAG data in panel A, Voyager 2/MAG data in panel B. Vr and VT derived by Krimigis et al. (2011) from analyses of energetic particle anisotropy measured by Voyager 1/LECP are shown as dots in panel C. Dots in panel D show Voyager 2/PLS data.
Current usage metrics show cumulative count of Article Views (full-text article views including HTML views, PDF and ePub downloads, according to the available data) and Abstracts Views on Vision4Press platform.
Data correspond to usage on the plateform after 2015. The current usage metrics is available 48-96 hours after online publication and is updated daily on week days.
Initial download of the metrics may take a while.