Fig. 1.
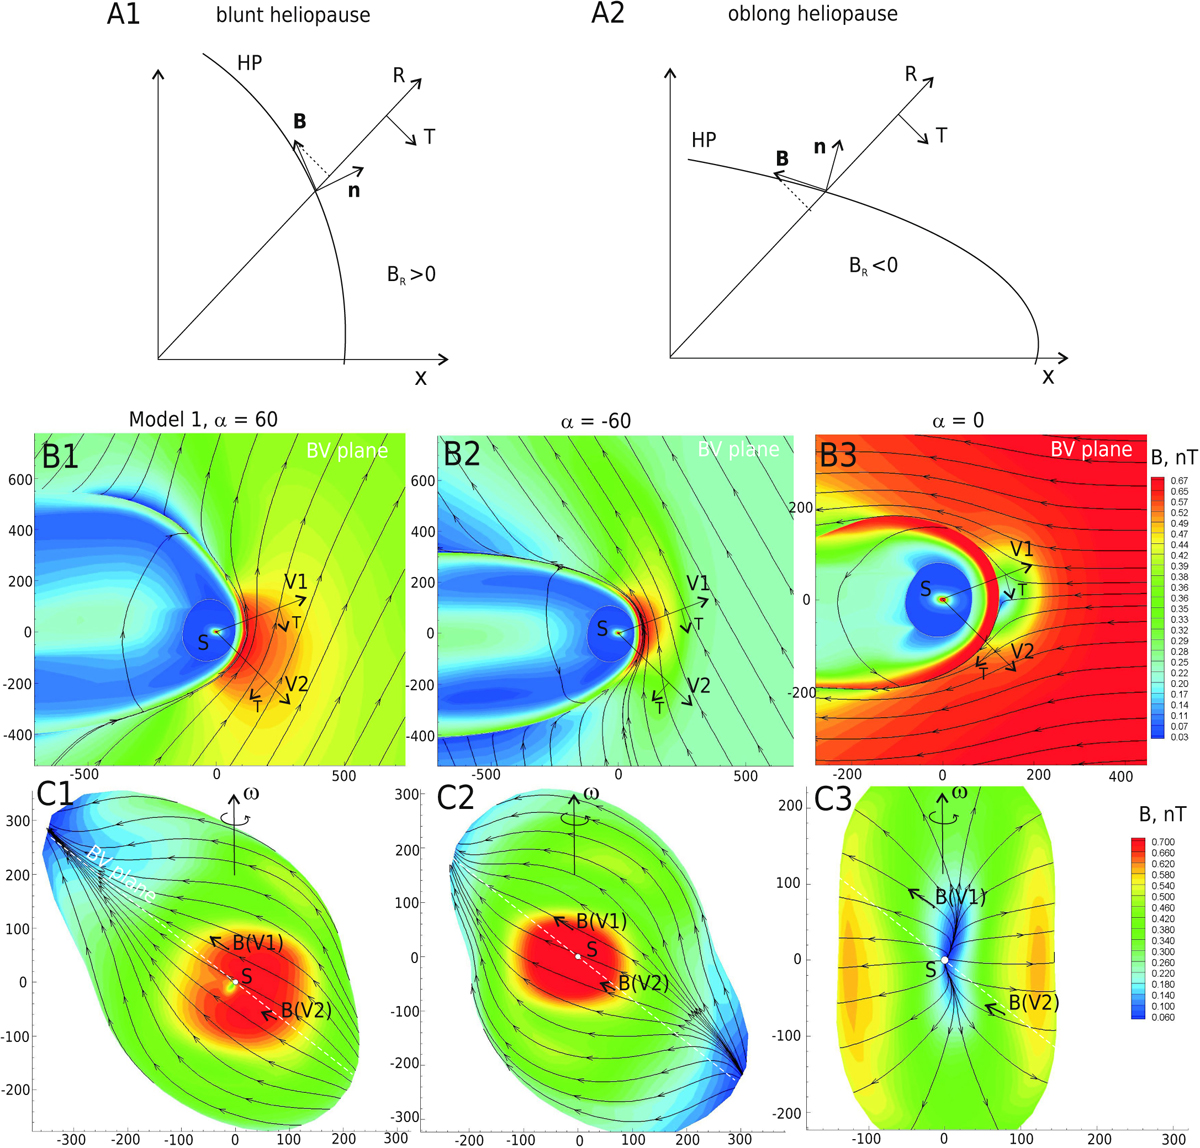
Panels A: sketch of the blunt (A1) and oblong (A2) shape of the heliopause. Panels B: magnetic field lines and magnitudes of the magnetic field in the plane determined by VLISM and BLISM vectors. Panel B1: a model with the magnetic field critical point above Voyager 1 (Model 1 hereafter); panel B2: a model with the magnetic field critical point (B = 0) below Voyager 2; panel B3: a model with the critical point located in between Voyager 1 and 2 (B3). Panels C: projections of magnetic field lines on the heliopause. Panels C1–C3: same models as panels B1, B2 and B3, respectively.
Current usage metrics show cumulative count of Article Views (full-text article views including HTML views, PDF and ePub downloads, according to the available data) and Abstracts Views on Vision4Press platform.
Data correspond to usage on the plateform after 2015. The current usage metrics is available 48-96 hours after online publication and is updated daily on week days.
Initial download of the metrics may take a while.