Fig. 4.
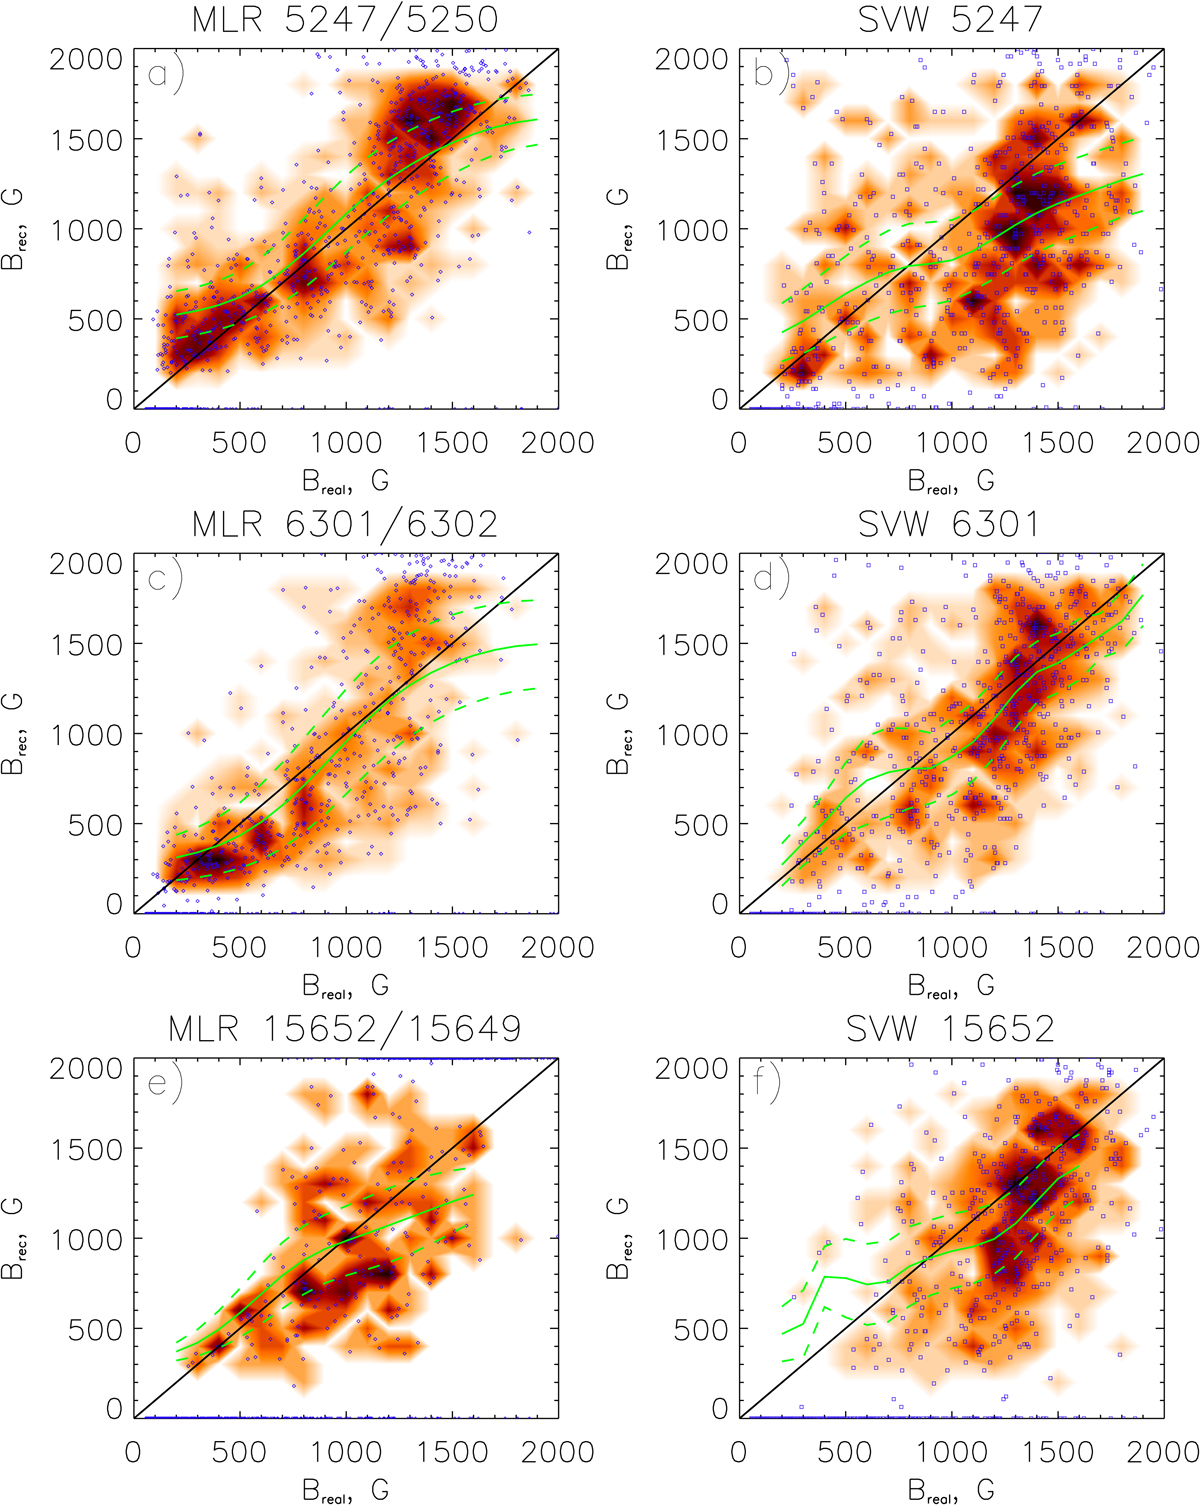
Values of intrinsic field calculated using MLR (left panels) and SVW (right panels) methods compared with the actual field values taken from the model. Panelsa, b; c, d and e, f correspond to the 5247/5250, 6301/6302 and 15652/15648 pairs, respectively. Solid green lines denote sliding average values (calculated with the 150 G windows); dashed green lines denote 1σ deviation from the sliding average values.
Current usage metrics show cumulative count of Article Views (full-text article views including HTML views, PDF and ePub downloads, according to the available data) and Abstracts Views on Vision4Press platform.
Data correspond to usage on the plateform after 2015. The current usage metrics is available 48-96 hours after online publication and is updated daily on week days.
Initial download of the metrics may take a while.