Fig. 2.
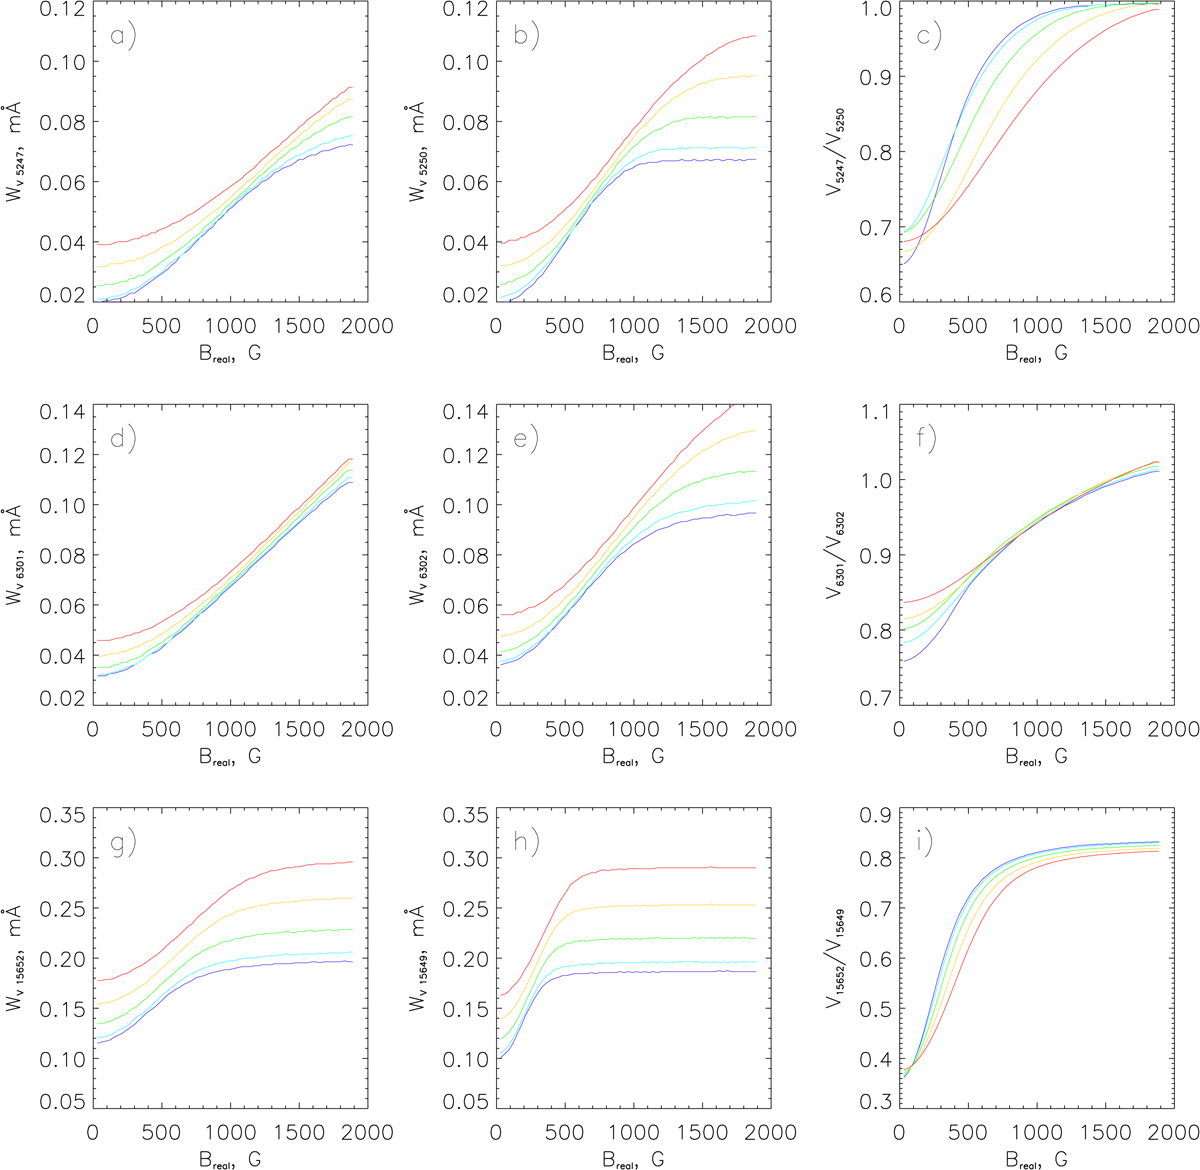
Calibration curves showing Stokes V width and MLR values as functions of the intrinsic field B for different turbulent velocities, which determine WI. The turbulent velocities vary from 0 (blue lines) to 20 km s−1 (red lines). Panelsa–c, d–f and g–i correspond to 5247/5250, 6301/6302 and 15652/15649 pairs, respectively. The left column (panels a, d and g) show Stokes V widths for lines with lower Lande factors g, the middle column (panels b, e and h) show Stokes V widths for lines with higher Lande factors g, and the right column (panels c, f and i) shows MLR values.
Current usage metrics show cumulative count of Article Views (full-text article views including HTML views, PDF and ePub downloads, according to the available data) and Abstracts Views on Vision4Press platform.
Data correspond to usage on the plateform after 2015. The current usage metrics is available 48-96 hours after online publication and is updated daily on week days.
Initial download of the metrics may take a while.