Fig. 7.
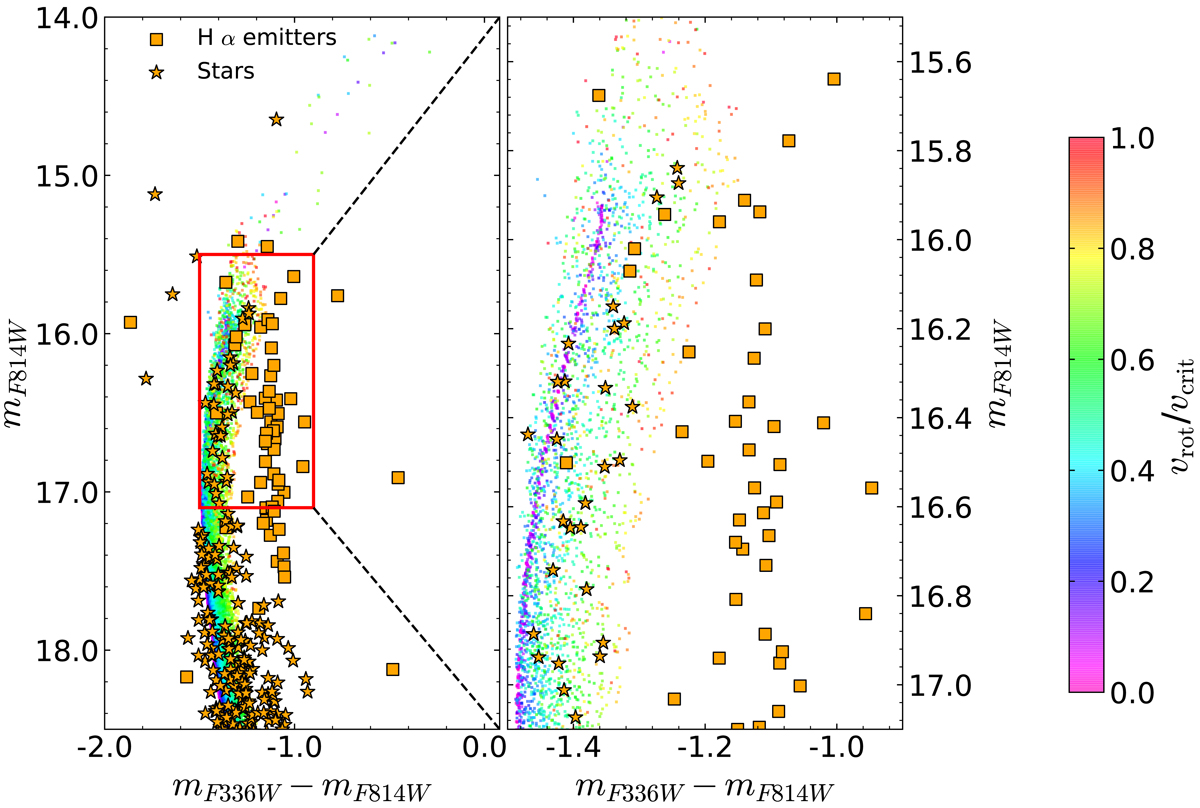
Synthetic colour–magnitude diagram of a 35 Myr star cluster at SMC metallicity, where each dot represents one single star and the colour gives the critical velocity fraction, vrot/vcrit as indicated by the colour bar. Gravity darkening is included assuming a random orientation of the rotation axis. Over plotted are observations of SMC cluster NGC 330 (Milone et al. 2018), with Hα emitters marked by orange squares and normal stars as orange star symbols. Right panel: region indicated by the red box in the left panel. To convert the models to apparent magnitudes a distance modulus of 18.92 mag and a reddening of 0.06 mag were used.
Current usage metrics show cumulative count of Article Views (full-text article views including HTML views, PDF and ePub downloads, according to the available data) and Abstracts Views on Vision4Press platform.
Data correspond to usage on the plateform after 2015. The current usage metrics is available 48-96 hours after online publication and is updated daily on week days.
Initial download of the metrics may take a while.