Fig. 5.
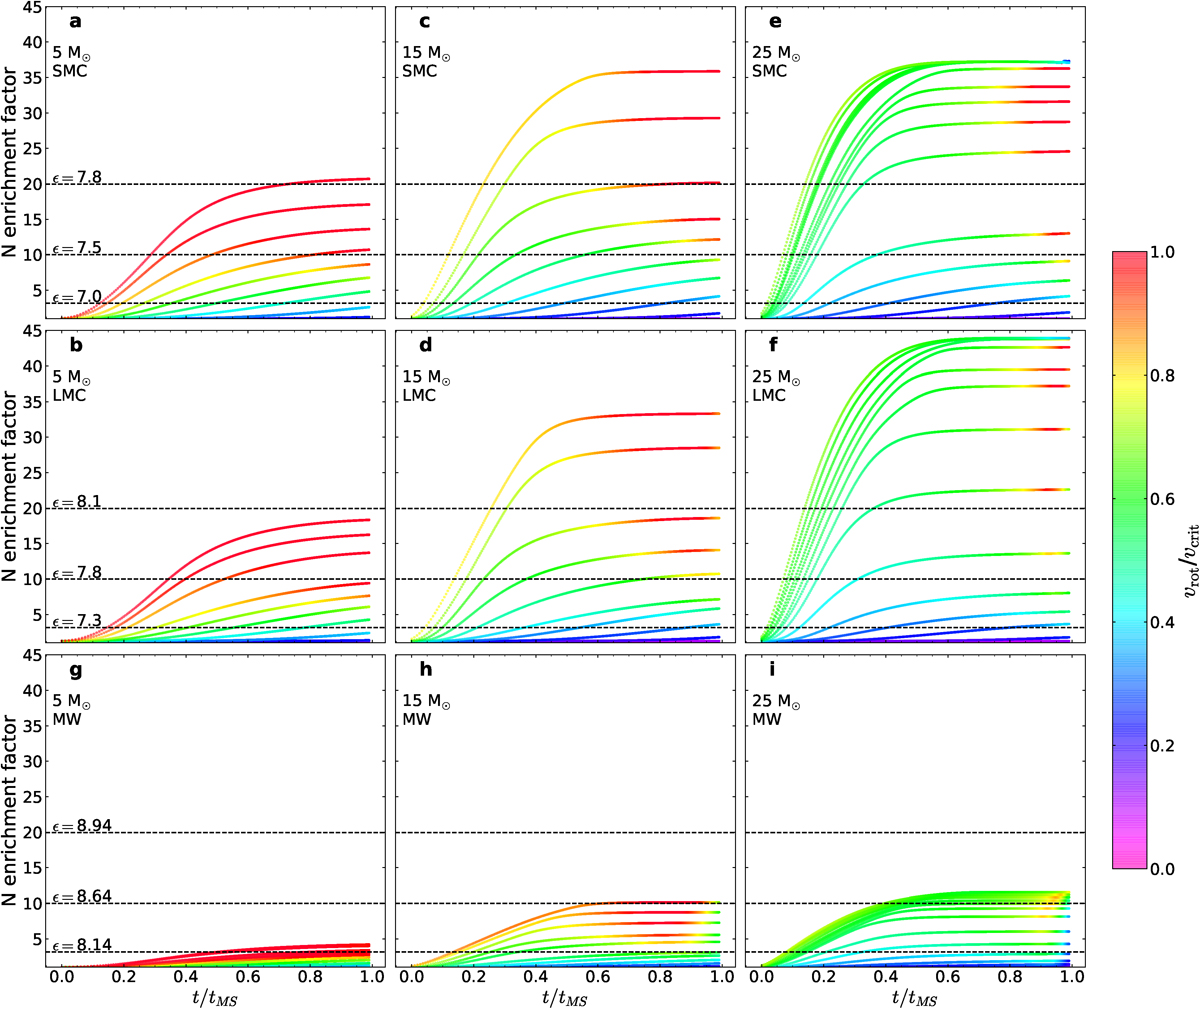
Surface nitrogen enrichment factor, computed as the nitrogen mass fraction divided by the initial nitrogen mass fraction as a function of the fractional hydrogen-burning lifetime, t/tMS, for models with initial rotational velocities between 0 and 600 km s−1 and initial masses of 5, 15, and 25 M⊙ as marked in the plot. Top, middle, and bottom panels: SMC, LMC, and MW compositions, respectively. The colour scale corresponds to the critical rotation fraction, vrot/vcrit. For each metallicity, various nitrogen abundances, ϵ = 12 + log(N/H), are displayed as dotted black lines with the value given in the plots of the left column.
Current usage metrics show cumulative count of Article Views (full-text article views including HTML views, PDF and ePub downloads, according to the available data) and Abstracts Views on Vision4Press platform.
Data correspond to usage on the plateform after 2015. The current usage metrics is available 48-96 hours after online publication and is updated daily on week days.
Initial download of the metrics may take a while.