Fig. 4.
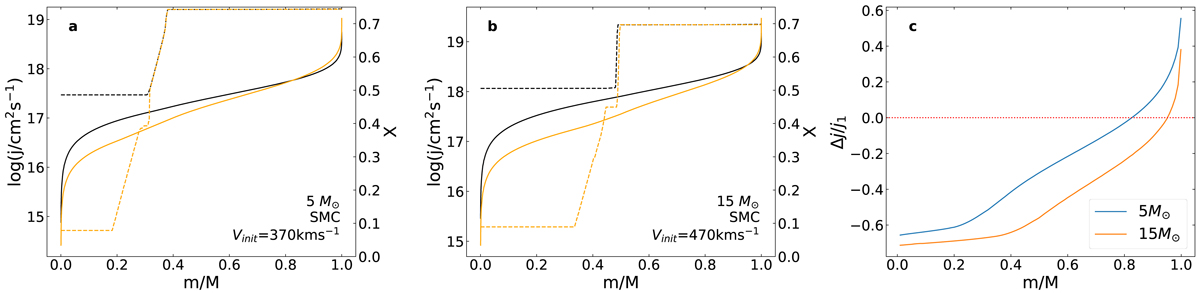
a and b: specific angular momentum (solid lines) and hydrogen mass fraction (dotted lines) profiles for two SMC models of masses 5 and 15 M⊙ and initial equatorial velocities of 370 and 470 km s−1 respectively. These are the same models plotted in panels b and d of Fig. 2 and both models have initial critical velocity fractions of around 0.6. Profiles are plotted for models where central helium mass fraction is 0.45 (black), and 0.91 (orange). c: for each model in panels a and b the fractional difference in specific angular momentum is plotted between the two times. The blue line represents the 5 M⊙ model, the orange the 15 M⊙ model. The dotted red line gives a reference for no angular momentum transport. The X-axis in all plots indicates the fractional mass co-ordinate.
Current usage metrics show cumulative count of Article Views (full-text article views including HTML views, PDF and ePub downloads, according to the available data) and Abstracts Views on Vision4Press platform.
Data correspond to usage on the plateform after 2015. The current usage metrics is available 48-96 hours after online publication and is updated daily on week days.
Initial download of the metrics may take a while.