Fig. 8
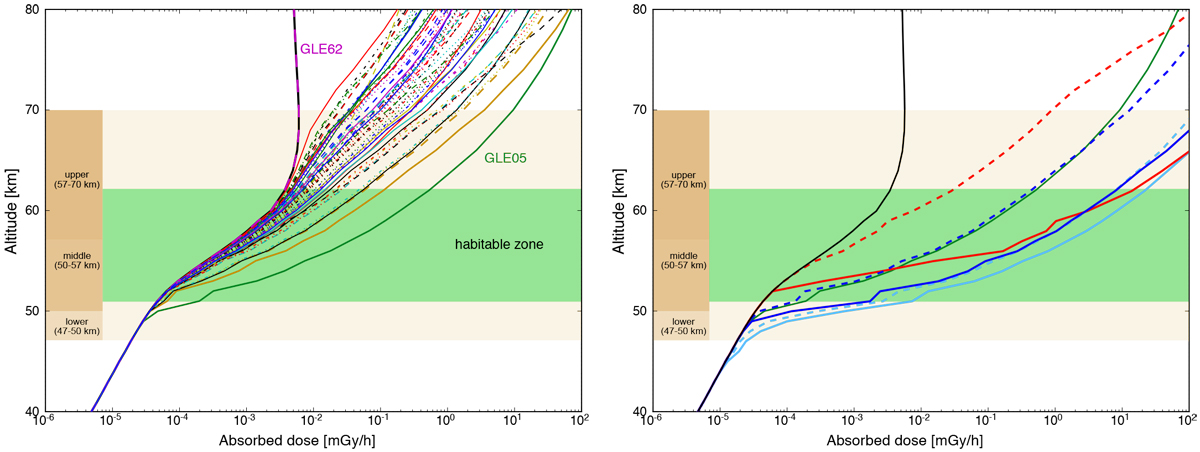
Left panel: influence of modern ordinary strong SEP events on the total (GCR + GLE-induced) Venusian absorbed dose of a water-based microbial cell (colored lines) within the Venusian cloud layers, and thus the potentially HZ. Of particular interest is the influence of the strongest event ever measured: GLE05 (green line). Right panel: event-induced absorbed dose rates of the historic Carrington (dashed lines) and AD774/775 event (solid lines) based on the GLE spectrum of February 1956 (GLE05, light blue), August 1972 (GLE24, red), and October 1989 (GLE45, blue). For comparison, the absorbed dose rates of the original GLE05 (see left panel) are displayed (solid green line).
Current usage metrics show cumulative count of Article Views (full-text article views including HTML views, PDF and ePub downloads, according to the available data) and Abstracts Views on Vision4Press platform.
Data correspond to usage on the plateform after 2015. The current usage metrics is available 48-96 hours after online publication and is updated daily on week days.
Initial download of the metrics may take a while.