Fig. 7
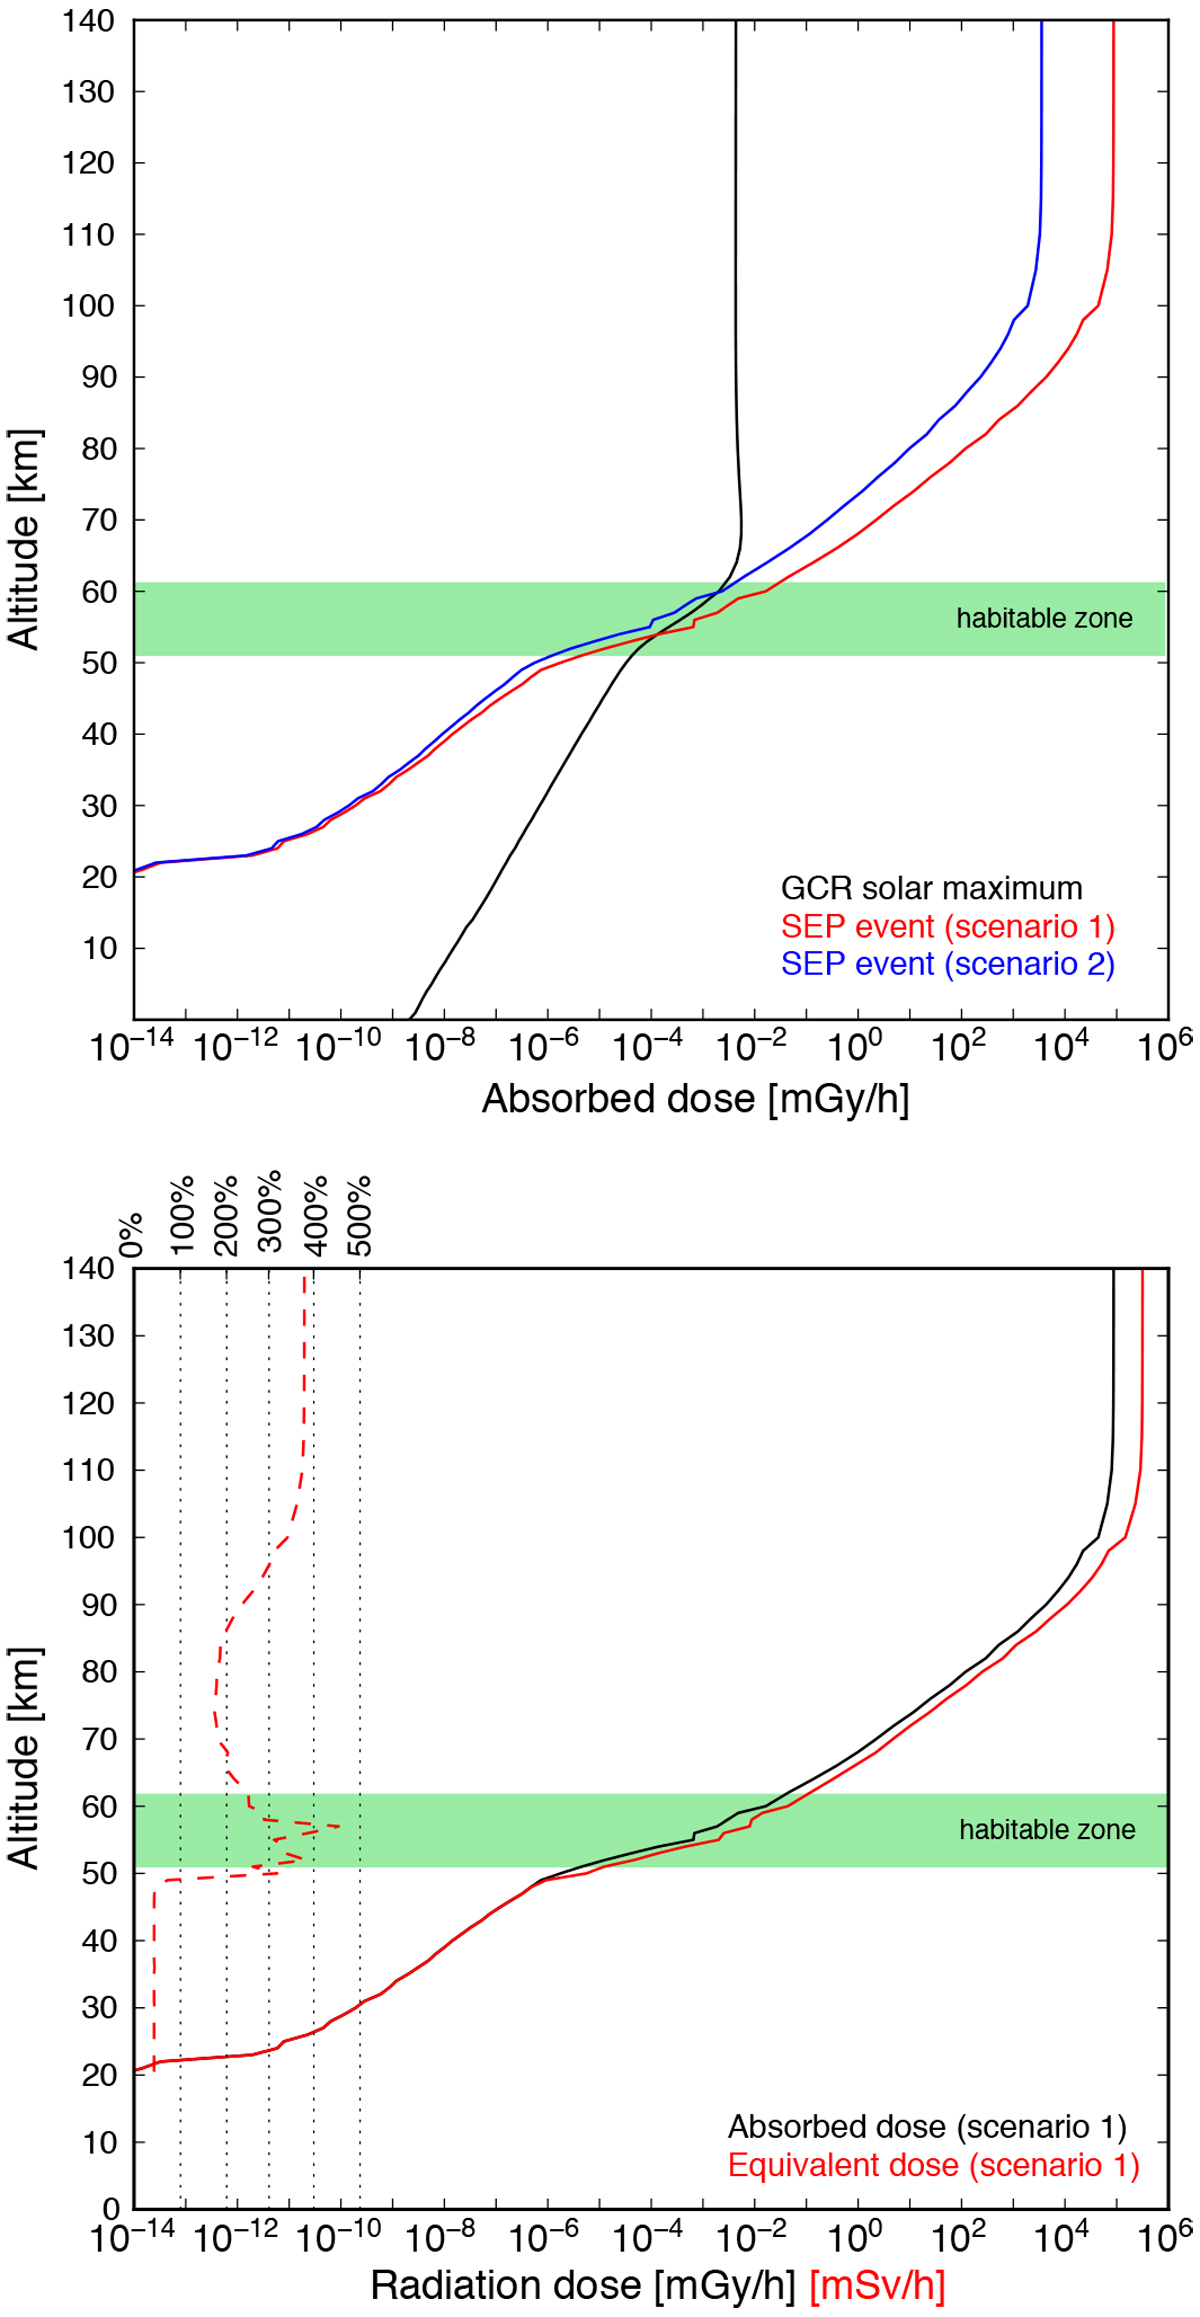
Upper panel: altitude-dependent absorbed dose rates induced by the October 1989 event. The results of scenario 1 are displayed as solid red line, those of scenario 2 as solid blue line. Lower panel: modeled absorbed dose rate and the dose equivalent of scenario 1. The ratio between the two quantities is given as red dashed line.
Current usage metrics show cumulative count of Article Views (full-text article views including HTML views, PDF and ePub downloads, according to the available data) and Abstracts Views on Vision4Press platform.
Data correspond to usage on the plateform after 2015. The current usage metrics is available 48-96 hours after online publication and is updated daily on week days.
Initial download of the metrics may take a while.