Free Access
Fig. 4
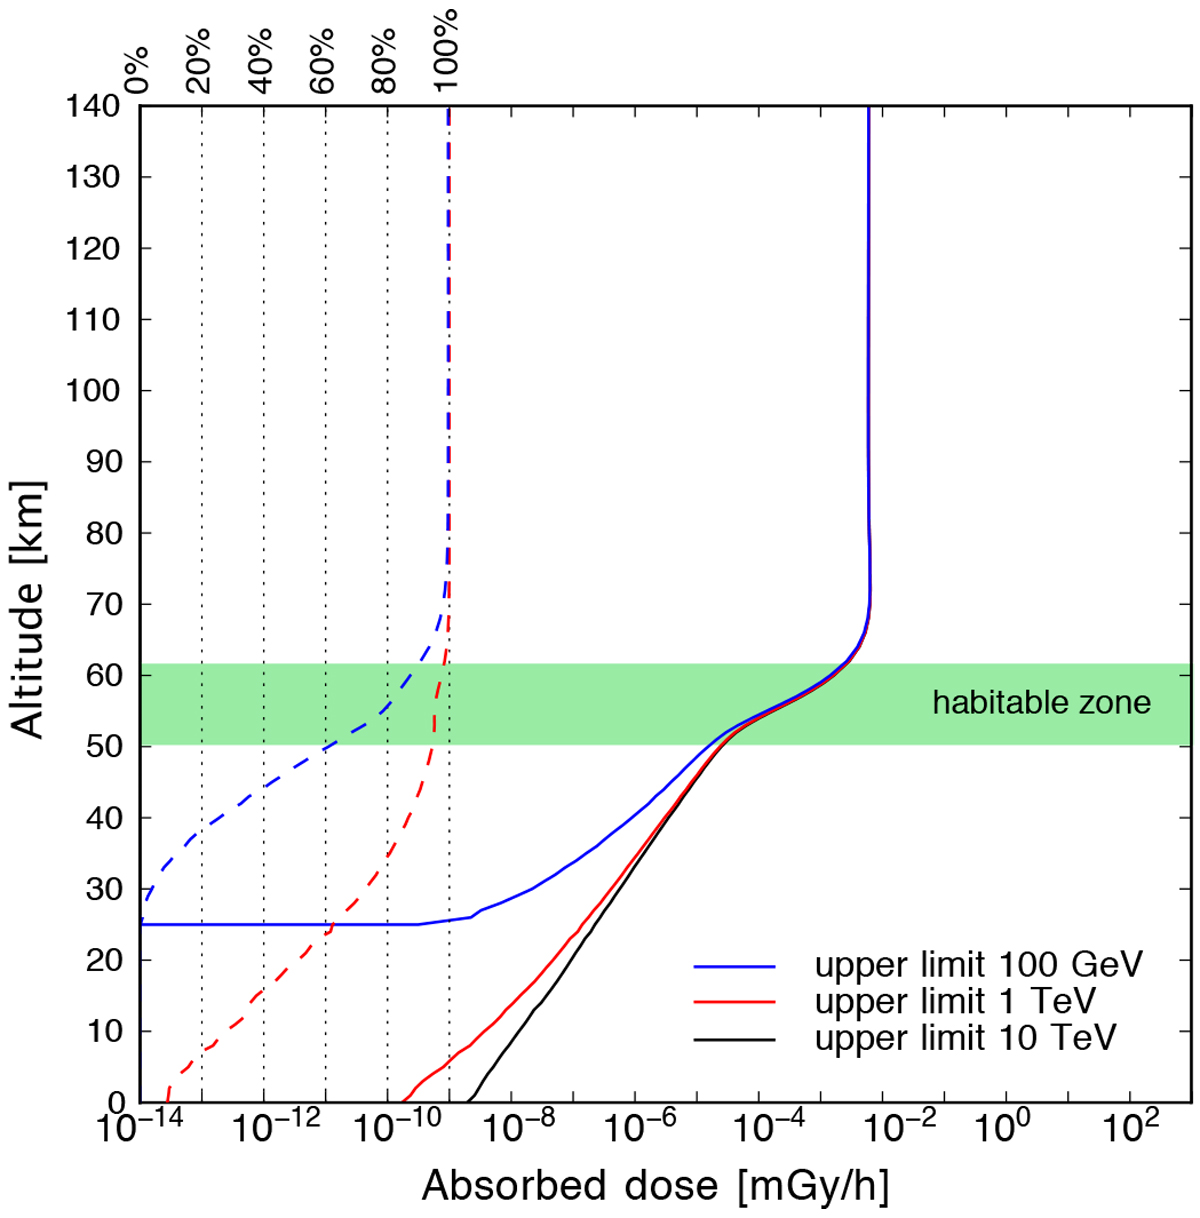
Altitude-dependent absorbed dose rate profiles depending on the upper energy limit. The solid blue, red, and black lines correspond to the upper limits equal to 100 GeV, 1 TeV, and 10 TeV. The dashed lines on the left indicate the relative difference with respect to the results based on an upper energy limit of 10 TeV.
Current usage metrics show cumulative count of Article Views (full-text article views including HTML views, PDF and ePub downloads, according to the available data) and Abstracts Views on Vision4Press platform.
Data correspond to usage on the plateform after 2015. The current usage metrics is available 48-96 hours after online publication and is updated daily on week days.
Initial download of the metrics may take a while.