Fig. 3
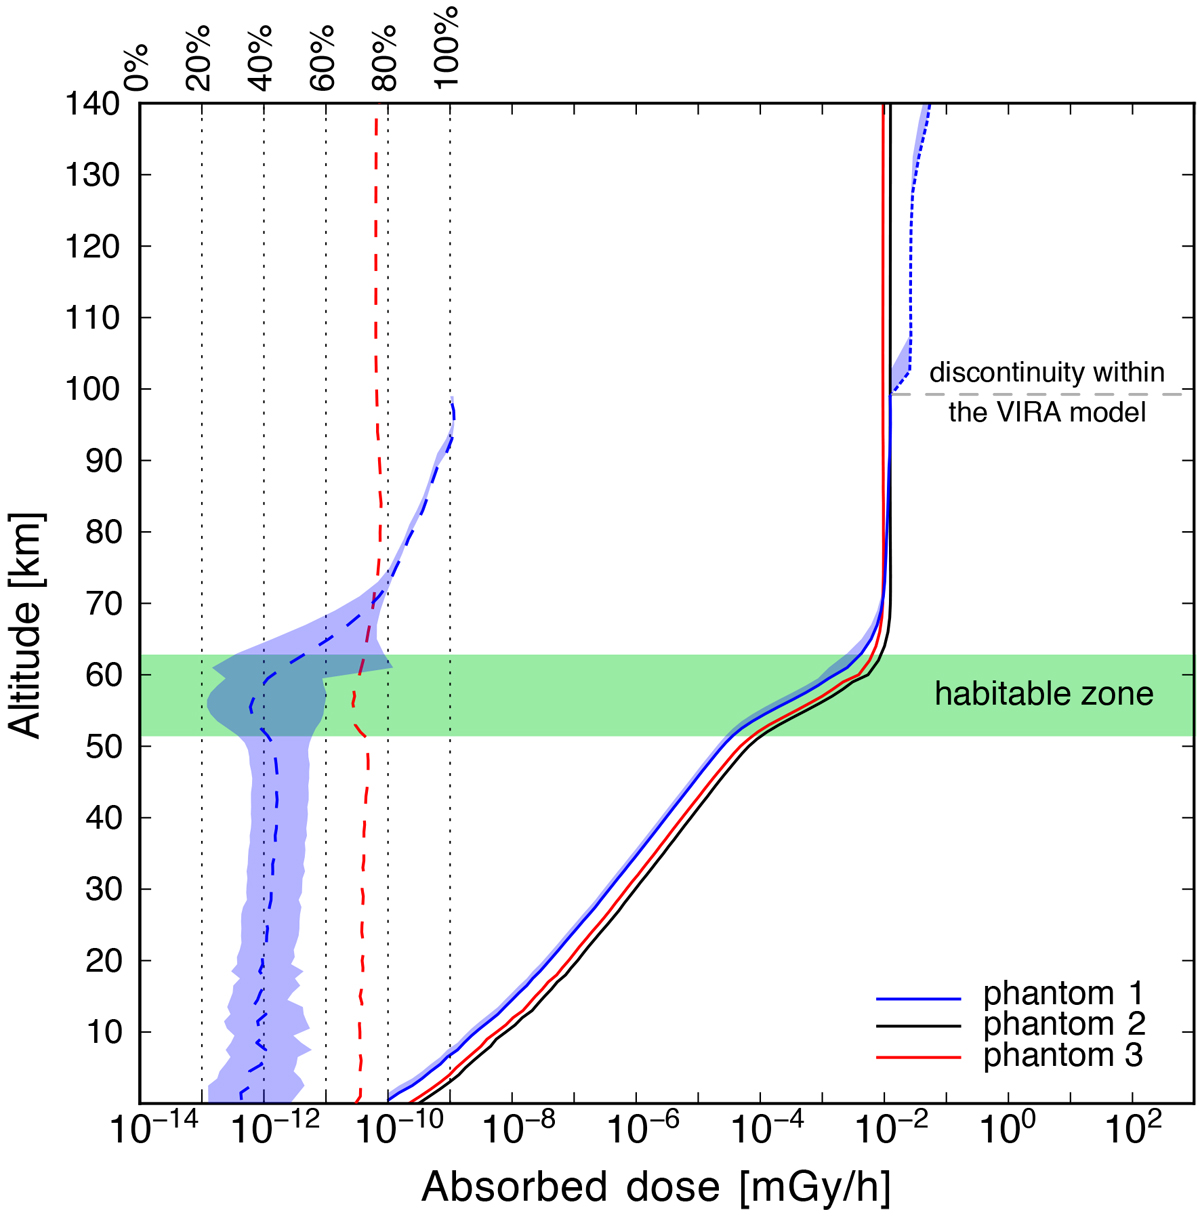
Altitude-dependent absorbed dose rate profiles encountered by the (H2O-based) ICRU phantom (solid black line), the Venusian air (solid blue line), and a microbial cell (solid red line). Also shown are the relative differences with respect to the ICRU sphere, displayed as dashed lines. For the dose in the air plot (blue line), the relative difference includes dotted lines that correspond to maximum and minimum differences, as described in detail in thetext.
Current usage metrics show cumulative count of Article Views (full-text article views including HTML views, PDF and ePub downloads, according to the available data) and Abstracts Views on Vision4Press platform.
Data correspond to usage on the plateform after 2015. The current usage metrics is available 48-96 hours after online publication and is updated daily on week days.
Initial download of the metrics may take a while.