Fig. 2
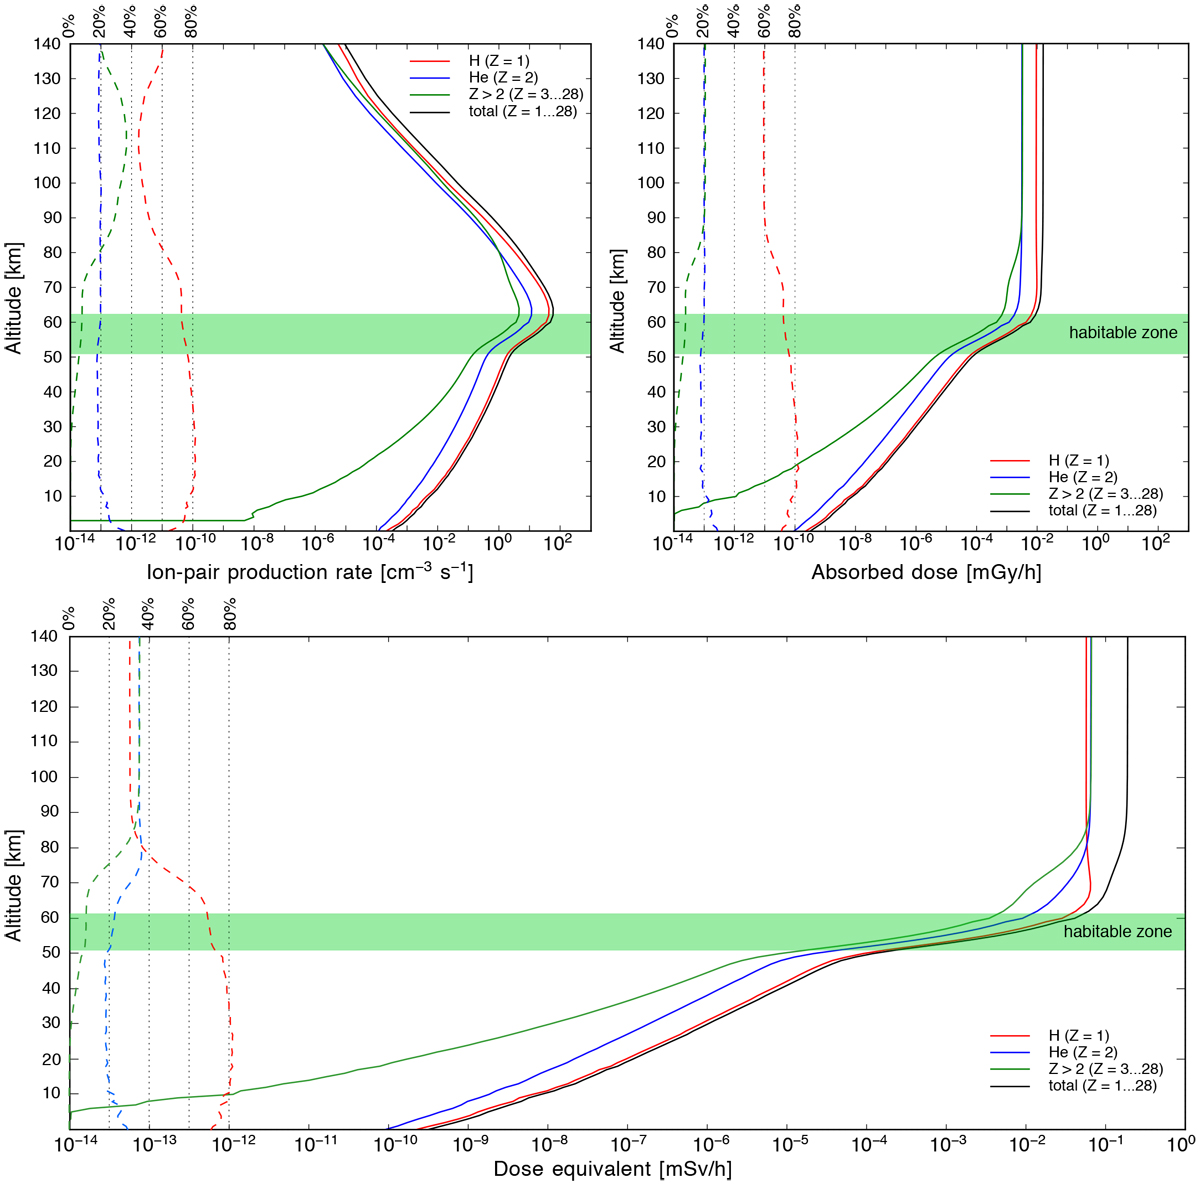
Left upper panel: altitude-dependent ion pair-production rates induced by primary protons (Z = 1, solid red line), alpha particles (Z = 2, solid blue line), and Z = 3–28 nuclei (solid green line). The total ion-pair production is given as solid black line. Right upper panel: modeled GCR-induced altitude-dependent absorbed dose rates. Lower panel: corresponding dose-equivalent rates. All three panels show the relative contributions of the GCR nuclei as dashed lines (notation on the upper x-axis).
Current usage metrics show cumulative count of Article Views (full-text article views including HTML views, PDF and ePub downloads, according to the available data) and Abstracts Views on Vision4Press platform.
Data correspond to usage on the plateform after 2015. The current usage metrics is available 48-96 hours after online publication and is updated daily on week days.
Initial download of the metrics may take a while.