Fig. 9.
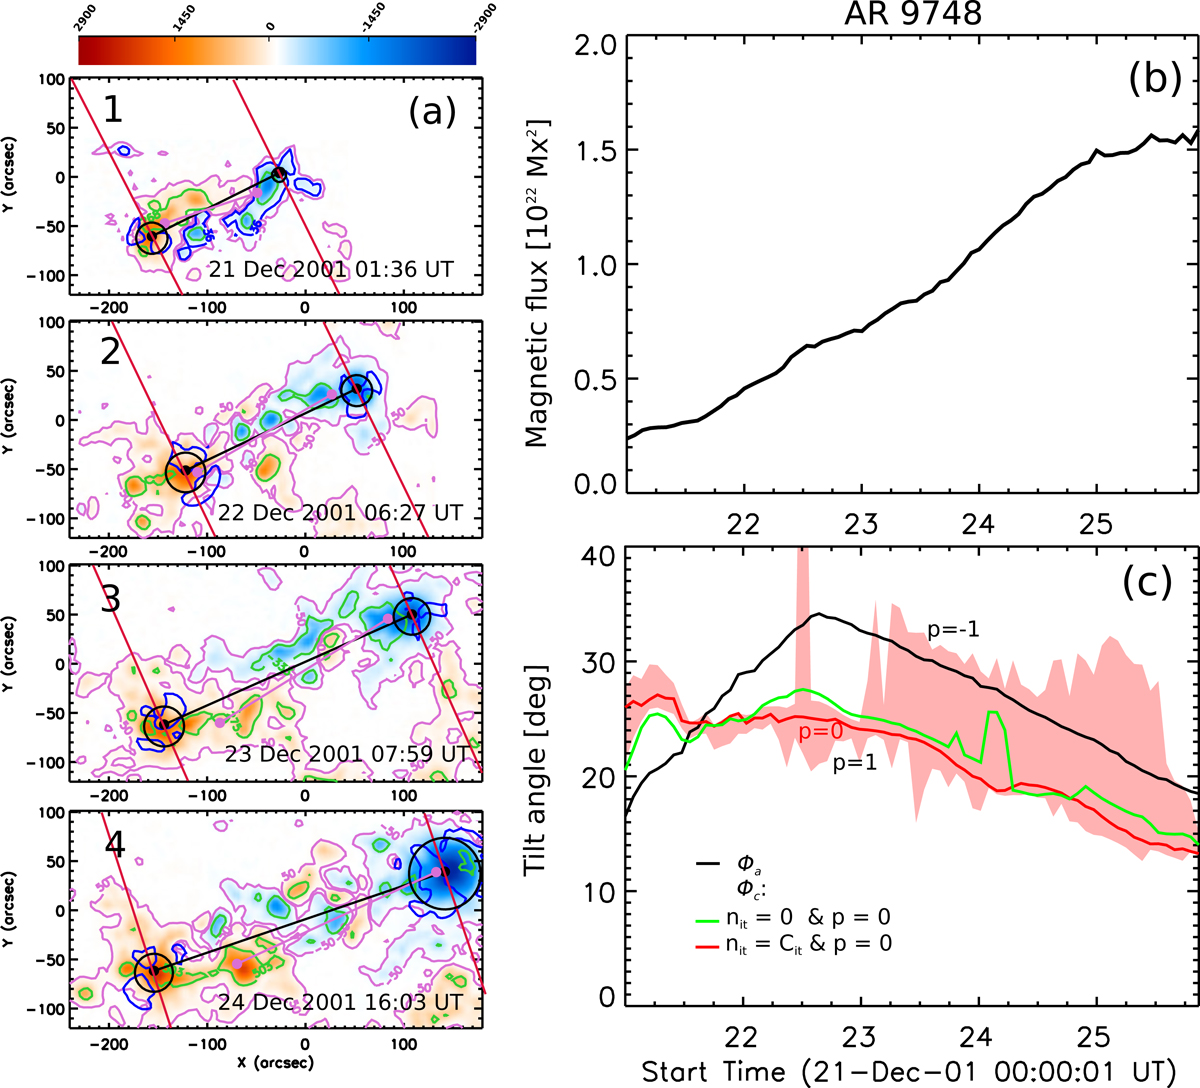
(a) SOHO/MDI magnetograms of AR 9748. The magnetograms have the same contours and colour convention as Fig. 7a. (b) Evolution of the AR magnetic flux computed from the magnetograms (black line). (c) Evolution of ϕa derived from the magnetic barycentres (black line) and ϕc obtained from the core flux centres with the same coloured pattern and input parameters as the ones used in Fig. 7c. The associated movie is available online (fig9_a.avi).
Current usage metrics show cumulative count of Article Views (full-text article views including HTML views, PDF and ePub downloads, according to the available data) and Abstracts Views on Vision4Press platform.
Data correspond to usage on the plateform after 2015. The current usage metrics is available 48-96 hours after online publication and is updated daily on week days.
Initial download of the metrics may take a while.