Fig. 8.
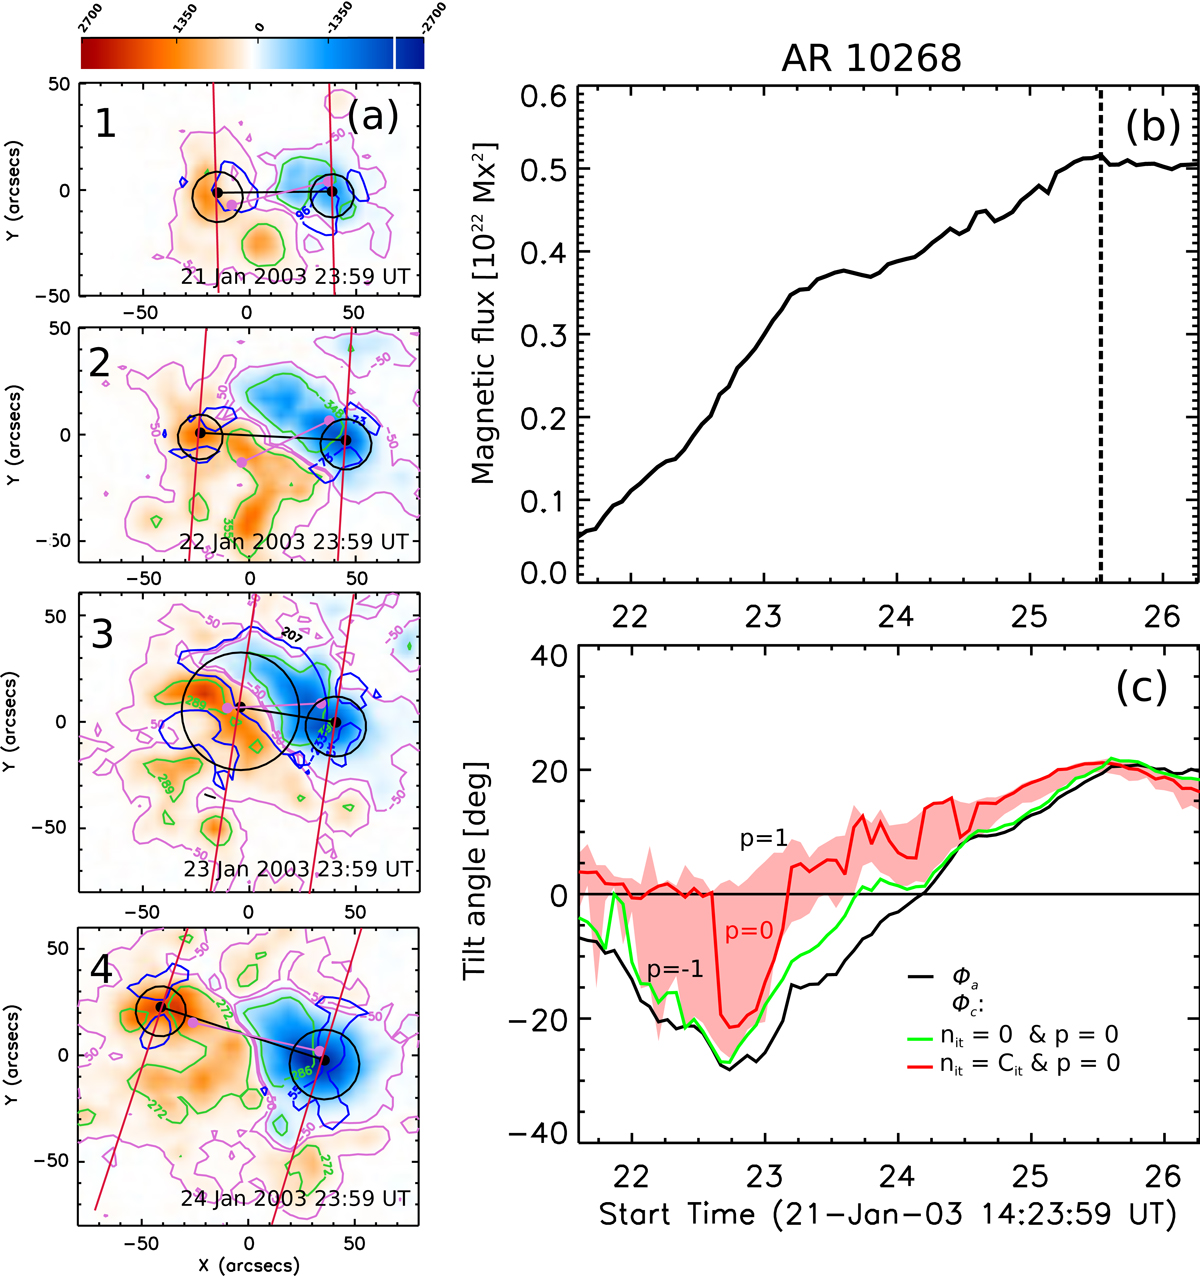
(a) SOHO/MDI magnetograms of AR 10268. The magnetograms have the same contours and colour convention as described in Fig. 7a. (b) Evolution of the AR magnetic flux computed from the magnetograms (black-solid line). The vertical-dashed line marks the time at which the AR 10268 reaches its maximum flux. (c) Evolution of ϕa derived from the magnetic barycentres and ϕc obtained with CoFFE (see inset). The drawing conventions are the same as in Fig. 7. The associated movie is available online (fig8_a.avi).
Current usage metrics show cumulative count of Article Views (full-text article views including HTML views, PDF and ePub downloads, according to the available data) and Abstracts Views on Vision4Press platform.
Data correspond to usage on the plateform after 2015. The current usage metrics is available 48-96 hours after online publication and is updated daily on week days.
Initial download of the metrics may take a while.