Fig. 7.
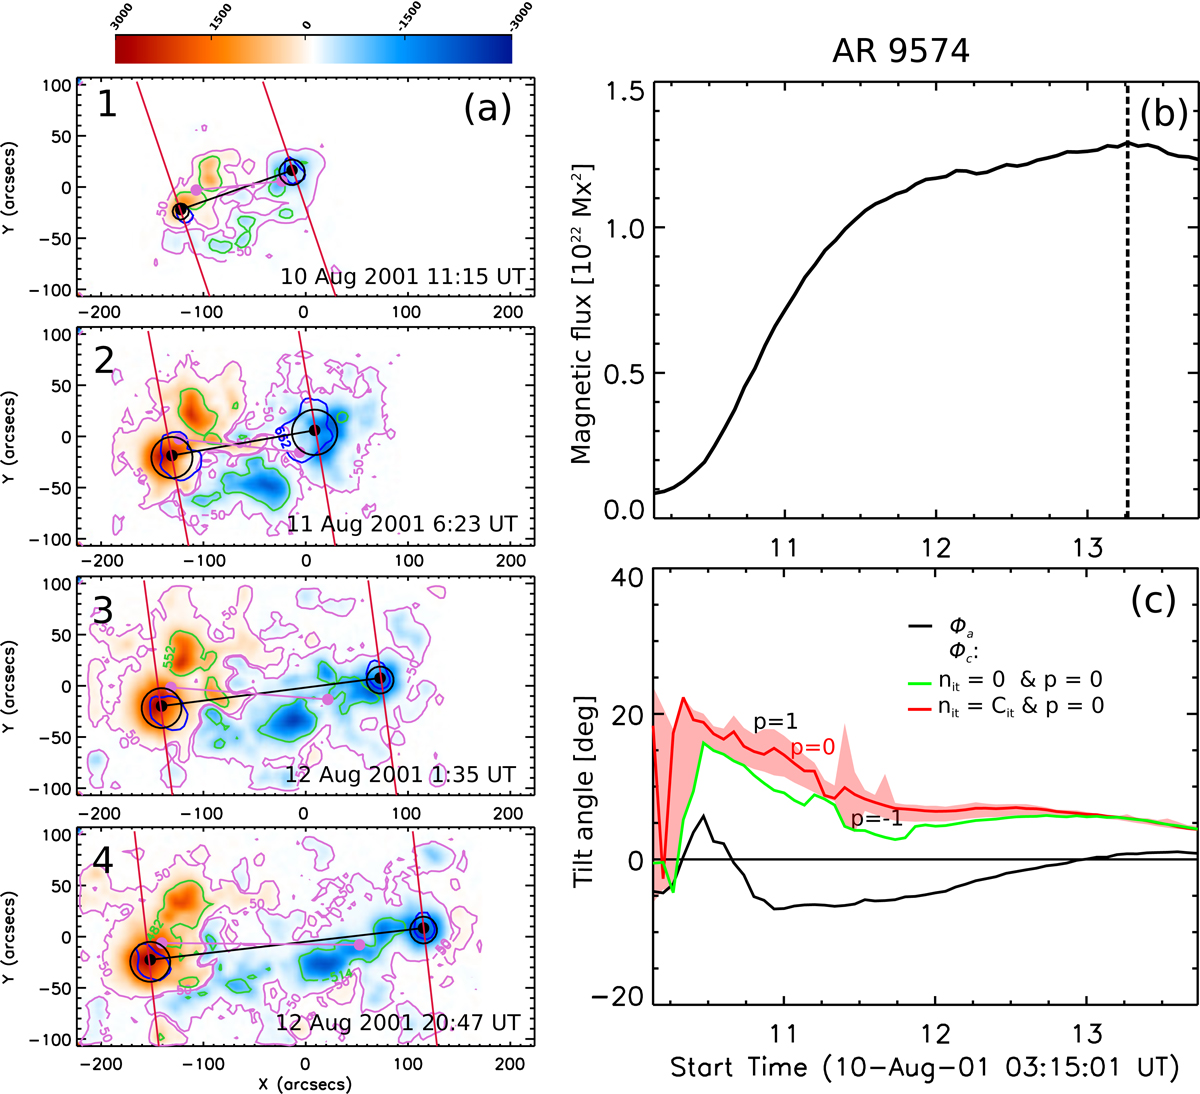
(a) SOHO/MDI LOS magnetograms of AR 9574. The red- and blue- shaded areas represent the positive and the negative Bz magnetic field component. The magenta contour in each map corresponds to the field magnitude of ±50 G. The black circular contours are the half-width level of the Gaussian fit for each polarity using p = 0 and nit = Cit. The green and blue isocontours indicate the areas where the field is larger and lower than the Gaussian, respectively, by 50% of the maximum difference between the Gaussian and the local observed field. The black and the magenta segments show the tilt of the AR respectively obtained with the core flux centres (which define ϕc) and the magnetic barycentres (which define the apparent tilt ϕa). (b) Evolution of the AR magnetic flux computed from the magnetograms. The vertical dashed line marks its maximum value. (c) Evolution of ϕa derived from the magnetic barycentres (black line) and ϕc obtained with CoFFE (see inset). The red-shaded area corresponds to the values of ϕc computed for p within the interval [−1, 1] after convergence criterion of the tilt angle is achieved. The associated movie is available online (fig7_a.avi).
Current usage metrics show cumulative count of Article Views (full-text article views including HTML views, PDF and ePub downloads, according to the available data) and Abstracts Views on Vision4Press platform.
Data correspond to usage on the plateform after 2015. The current usage metrics is available 48-96 hours after online publication and is updated daily on week days.
Initial download of the metrics may take a while.