Fig. 6.
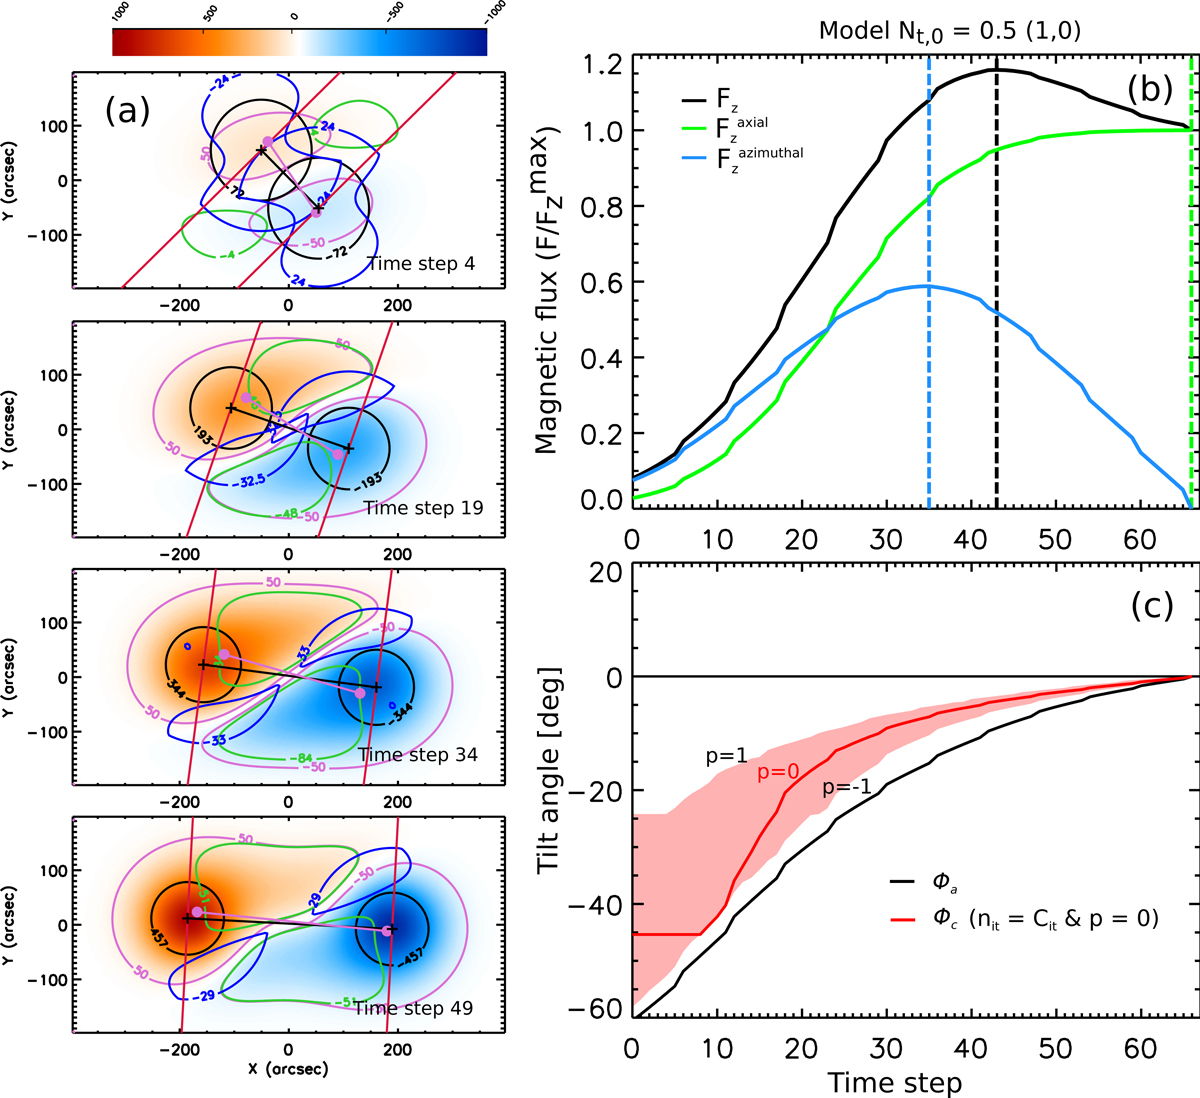
(a) Synthetic Bz magnetograms for the model with a twist profile increasing with the radial coordinate of the torus (Nt, 0 = 0.5 and h = 1, defined in Eq. (2) at time steps 4, 19, 34, and 49). We use the same colour code and contours as in Fig. 3. The segments join the polarities barycentres (magenta line) and the core centres (black line). (b) Computed Fz (black), ![]() (blue), and
(blue), and ![]() (green) along the FR emergence. Dashed-vertical lines indicate the time step of each maximum flux with their respective colour. All fluxes are normalised to the maximum value of
(green) along the FR emergence. Dashed-vertical lines indicate the time step of each maximum flux with their respective colour. All fluxes are normalised to the maximum value of ![]() . (c) Evolution of the apparent tilt ϕa computed from the magnetic barycentres (black line) and of ϕc using CoFFE (see the inset). The red-shaded area corresponds to the values of ϕc computed for p within the interval [−1, 1] after the convergence criterion of the tilt angle is achieved. The associated movie is available online (fig6_a.avi).
. (c) Evolution of the apparent tilt ϕa computed from the magnetic barycentres (black line) and of ϕc using CoFFE (see the inset). The red-shaded area corresponds to the values of ϕc computed for p within the interval [−1, 1] after the convergence criterion of the tilt angle is achieved. The associated movie is available online (fig6_a.avi).
Current usage metrics show cumulative count of Article Views (full-text article views including HTML views, PDF and ePub downloads, according to the available data) and Abstracts Views on Vision4Press platform.
Data correspond to usage on the plateform after 2015. The current usage metrics is available 48-96 hours after online publication and is updated daily on week days.
Initial download of the metrics may take a while.