Fig. 5.
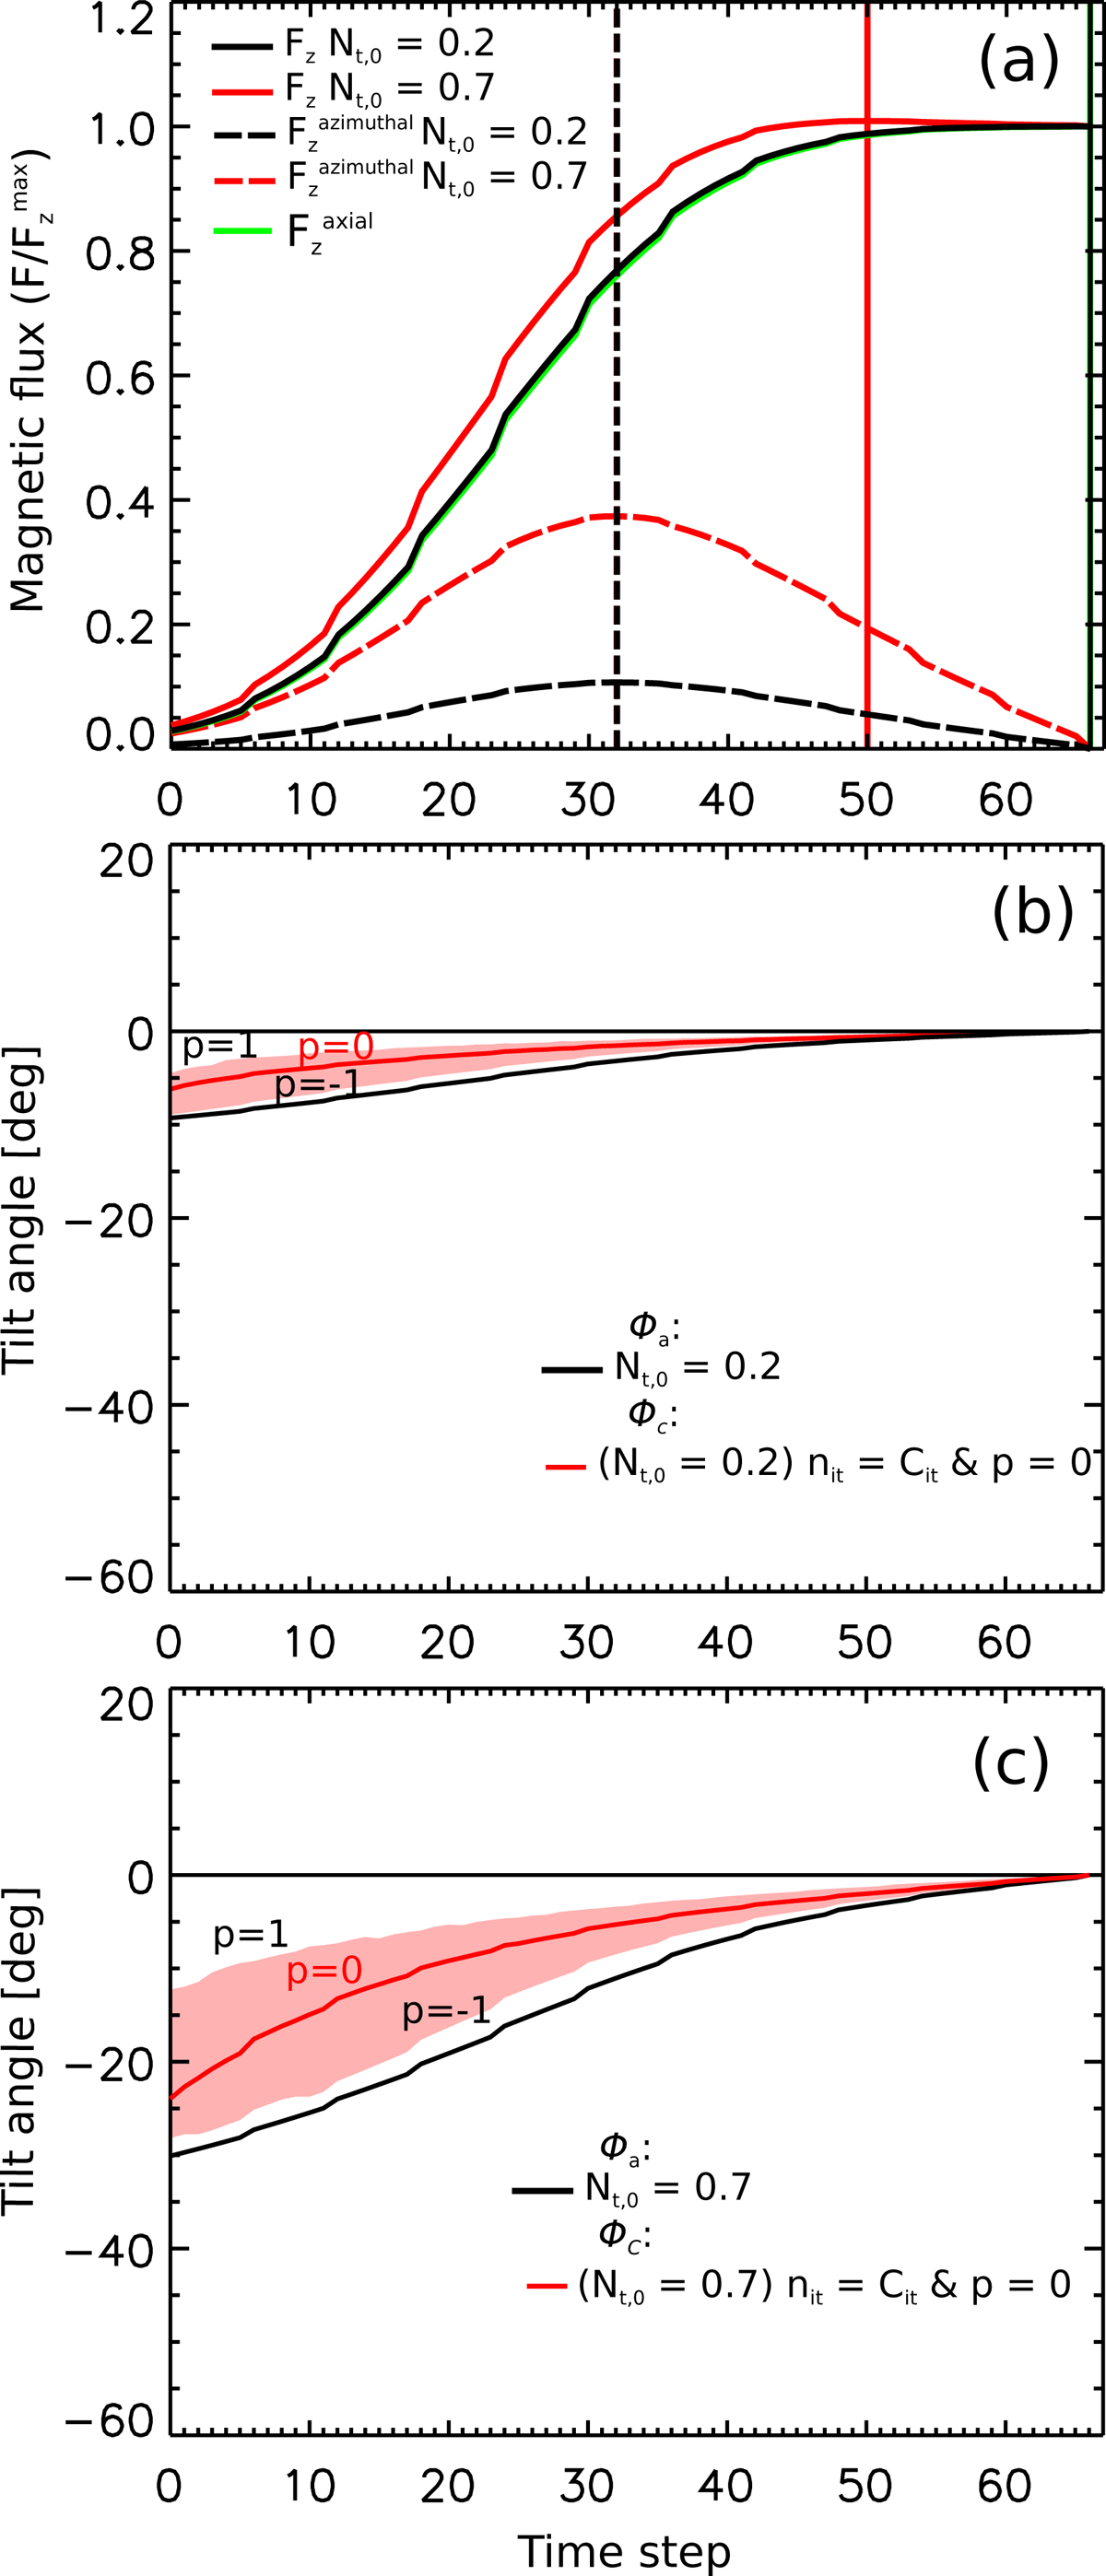
Comparison of the magnetic flux and the tilt angle evolution for uniform twist models (h = 0 and g = 0) with Nt, 0 = 0.2 and Nt, 0 = 0.7. (a) Evolution of the magnetic flux, Fz (continuous lines), the azimuthal flux, ![]() (dashed lines), and the axial flux,
(dashed lines), and the axial flux, ![]() (green-continuous line) for the models with Nt, 0 = 0.2 (black) and Nt, 0 = 0.7 (red). The vertical continuous lines (with the same black and red colours) show respectively the time step in which each model reaches its maximum Fz flux. The black-dashed vertical line indicates the time step in which
(green-continuous line) for the models with Nt, 0 = 0.2 (black) and Nt, 0 = 0.7 (red). The vertical continuous lines (with the same black and red colours) show respectively the time step in which each model reaches its maximum Fz flux. The black-dashed vertical line indicates the time step in which ![]() is maximum. All fluxes are normalised to the maximum
is maximum. All fluxes are normalised to the maximum ![]() . (b)–(c) Evolution of the tilt angle for models with (b) Nt, 0 = 0.2 and (c) Nt, 0 = 0.7. The black and red lines show the tilt angle estimations of ϕa and ϕc (see inset), respectively. The red-shaded areas correspond to the values of ϕc computed for p within the interval [−1, 1]. The associated movies are available online (fig5_b.avi and fig5_c.avi).
. (b)–(c) Evolution of the tilt angle for models with (b) Nt, 0 = 0.2 and (c) Nt, 0 = 0.7. The black and red lines show the tilt angle estimations of ϕa and ϕc (see inset), respectively. The red-shaded areas correspond to the values of ϕc computed for p within the interval [−1, 1]. The associated movies are available online (fig5_b.avi and fig5_c.avi).
Current usage metrics show cumulative count of Article Views (full-text article views including HTML views, PDF and ePub downloads, according to the available data) and Abstracts Views on Vision4Press platform.
Data correspond to usage on the plateform after 2015. The current usage metrics is available 48-96 hours after online publication and is updated daily on week days.
Initial download of the metrics may take a while.